In his latest technical analysis, Christopher Inks, a recognized figure in the field of crypto analysis, points to the possible formation of a bullish Adam and Eve double bottom pattern for Bitcoin. This formation is spotted on the BTC/USD 1-hour chart and has significant implications for the cryptocurrency’s short-term price action.
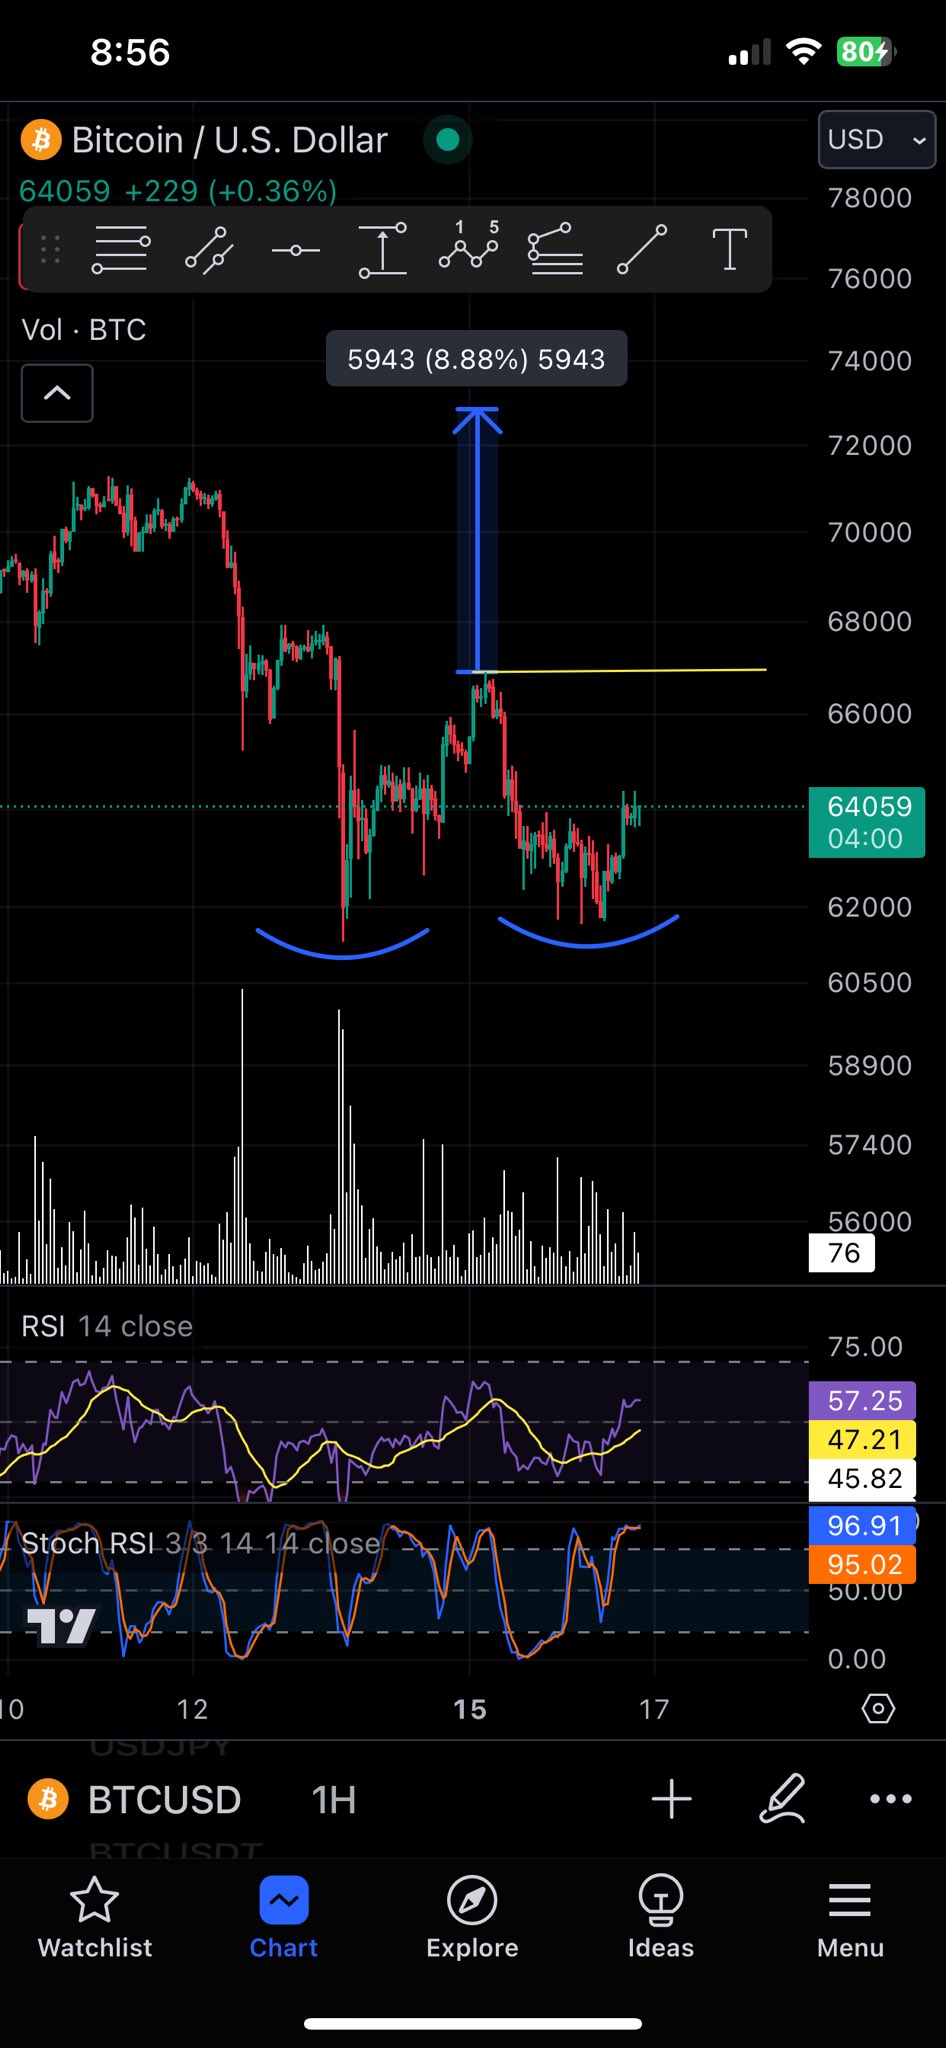
The chart depicts Bitcoin’s price movement with a distinct pattern that resembles two troughs with a peak in between. The first trough, known as the “Adam,” is characterized by a sharp, V-shaped bottom, indicating a rapid price decline and equally swift rebound. This is followed by a more rounded, gradual, and wider “Eve” trough, suggesting a slower and more deliberate price recovery.
Bitcoin Targets Its All-Time High
In this analysis, the price level to watch is marked by a horizontal yellow line, which Inks suggests is the neckline of the pattern. A breakout and close above this neckline would confirm the pattern, signaling a potential bullish reversal. The importance of this neckline, which lies around the $67,000 price level, cannot be overstated as it represents a key resistance point that the price needs to surpass to confirm the pattern.
To derive the target of the pattern, Inks uses the depth of the formation, measuring from the neckline to the lowest point of the Adam trough. This height (8.88%) is then projected upward from the breakout point, suggesting that the pattern target would be in the area of $73,000, close to Bitcoin’s all-time high (ATH).
Other technical indicators on the chart include volume, the Relative Strength Index (RSI), and the Stochastic RSI. Volume, denoted at the bottom of the chart, has shown a significant peak at the formation of the Adam bottom, followed by less pronounced volume during the formation of the Eve. This volume profile often accompanies the Adam and Eve pattern and can serve as a confirmation signal of the bullish sentiment.
The RSI, a momentum oscillator that measures the speed and change of price movements, is at 47, neutral territory, showing that neither bulls nor bears have gained full control yet. The Stochastic RSI, a more sensitive indicator that combines the features of stochastic oscillators and RSI, is indicating a strong upward momentum, with a reading above 95 out of 100, which could suggest potential for a short-term pullback due to overbought conditions.
Finally, it’s important to note that the Stochastic RSI is showing a crossover in the overbought territory, which can sometimes precede a price correction. However, given the bullish pattern indicated by the Adam and Eve formation, the sentiment appears to lean towards an optimistic outlook. If BTC price breaks above $67,000 and closes a hour-candle above this threshold, the bulls could target the all-time high at $73,780.
At press time, BTC traded at $63,571.


