Bitcoin has been endeavoring to shift its trajectory from a downturn to an upswing. However, despite its efforts, the coin has remained on a downward trend for several days following its inability to surpass its previous all-time high of $73,833.
Will Bitcoin Continue Upward After This Rejection?
At the time of writing, the price of BTC was trading around $63,846 which was about 27% down from its all-time high and was up by 0.06% in the last 24 hours. Although the price is trading below the 100 Simple Moving Average (SMA) on the 4-hour chart, on the daily chart it is still trading above the 100 SMA
Looking at the support and resistance lines in the below image, it can be seen that the price has tried to break the support level of $59,579 twice and has failed. The first time Bitcoin reached this level, it pushed the price upward to create a new all-time high. Thus, now that it has hit this level again, it might push BTC even further.
The circles in the image indicate the two points:
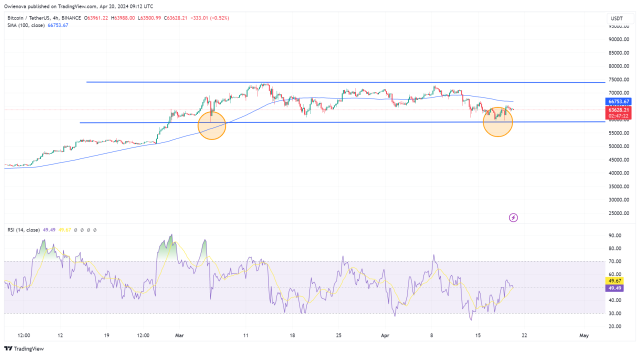
Also, with the formation of the Relative Strength Index (RSI) in the image, the indicator suggests an upward movement as the RSI signal line is seen trending slightly above the 50% level. This also suggests that buyers are still very active in the market and against the sellers.
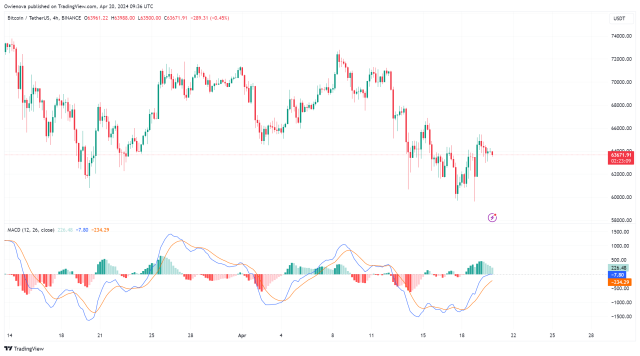
The MACD indicator from the 4-hour chart also suggests that BTC might move upward as the MACD histograms are trending above the zero line. Both the MACD line and the Signal line have crossed and are about to cross above the MACD zero line, indicating a bullish trend, as seen in the below image.
Possible Trend That Could Play Out
In other words, since the price of Bitcoin is trying the move upward, if it manages to break above the minor resistance level of $67,895.24, it might begin to move toward its major resistance level of $73,833.34. Furthermore, should prices surpass this level, it might even move further to create a new all-time high.
On the contrary, if Bitcoin fails to move above its previous highs, it might move downward toward its previous support level of $59,579.72. If it breaks below the zone, the price might encounter a deeper correction to create a new low.


