Josh Olszewicz, a renowned crypto analyst, has recently shared critical insights into the immediate Bitcoin price future, employing two technical analysis frameworks: the Ichimoku Cloud and Bollinger Bands. These tools hint at pivotal moments that could shape the trajectory of the Bitcoin price in the near to medium term.
Bitcoin Analysis Using The Ichimoku Cloud
In the first chart featuring the daily Ichimoku Cloud, Olszewicz highlights a critical moment for Bitcoin as it navigates through this complex indicator. The Ichimoku Cloud, known for providing support and resistance levels as well as momentum and trend direction, shows Bitcoin trading near the edge of the cloud. This is significant because a break above the cloud could suggest a bullish outlook, while falling below the cloud often signals bearish momentum.
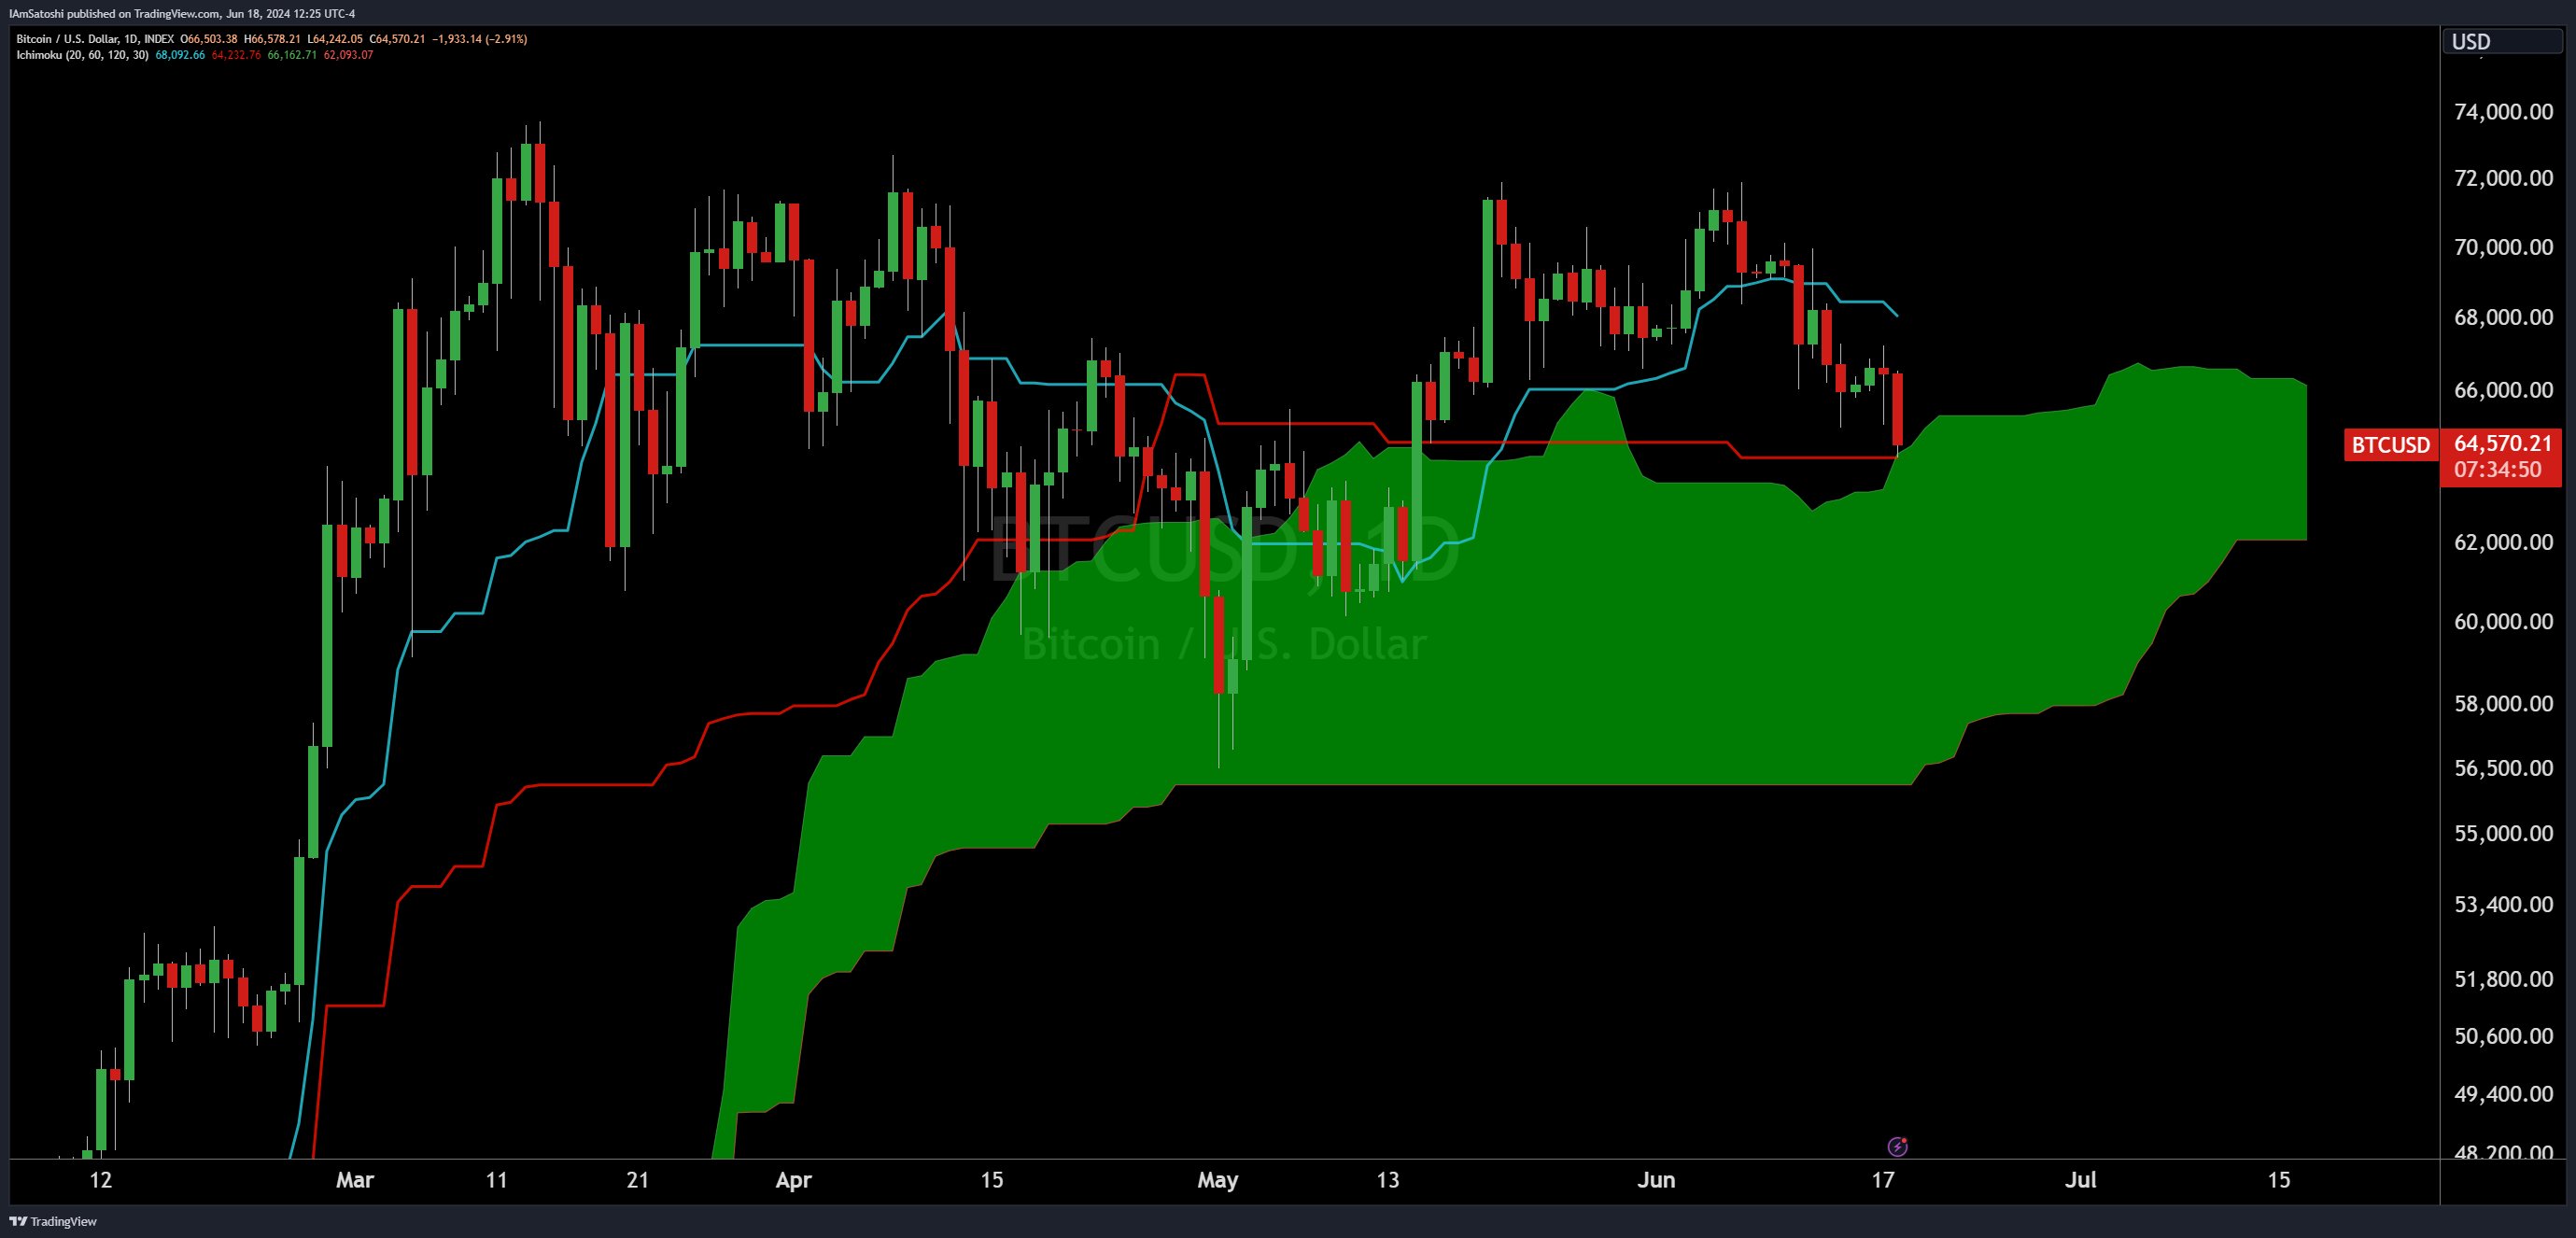
Here, Olszewicz emphasizes a ‘do or die’ scenario for Bitcoin. The price of Bitcoin, as recorded last on the chart at $64,570, approaches the edge of the cloud. “No one likes an ultimatum but it’s do or die here pretty soon on the daily BTC cloud,” warned.
A significant aspect of the Ichimoku Cloud chart is the relationship between the Tenkan-Sen (red line) and the Kijun-Sen (blue line). The Tenkan-Sen, which is a shorter-term moving average, remains above the Kijun-Sen, a longer-term moving average, indicating a positive momentum in the short run.
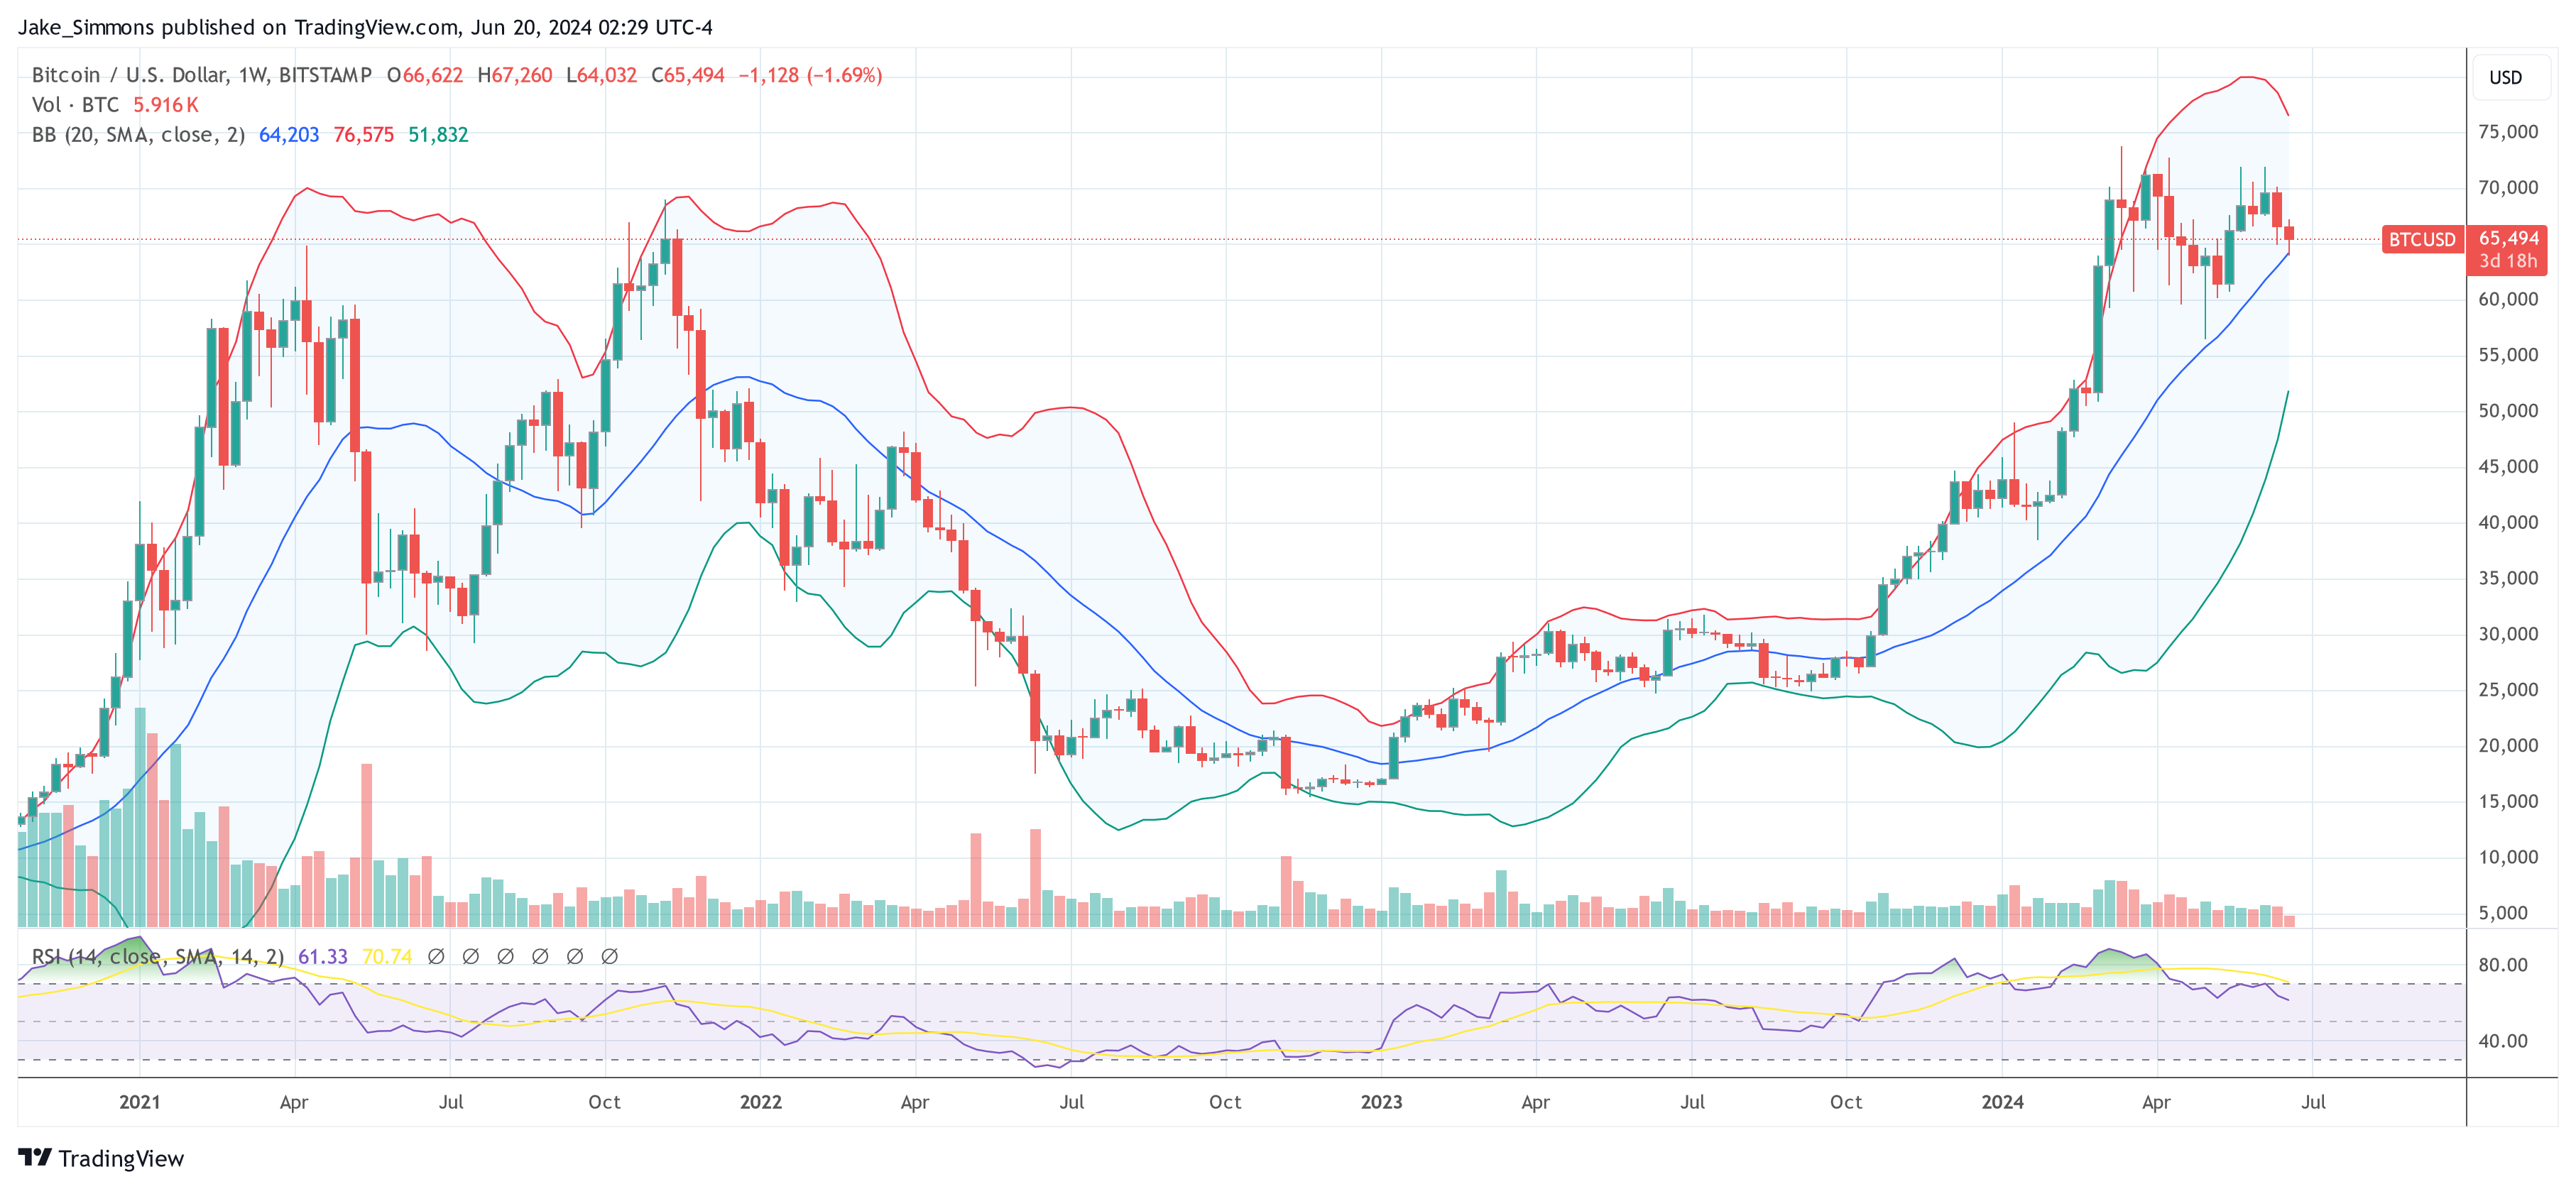
Bollinger Bands Weekly Analysis
Moving to the weekly chart equipped with Bollinger Bands, Olszewicz discusses another potential inflection point. Bollinger Bands serve as a measure of volatility—narrow bands suggest low volatility while wider bands indicate higher volatility. The Bitcoin chart shows a tightening of these bands around the current price level, which may precede a significant price movement, often referred to as a “Bollinger Band Squeeze.”
The fact that Bitcoin is hovering just above the midline (the 20-period moving average) of the Bollinger Bands at $64,238 points to a tenuous balance between buying and selling forces. However, the narrowing of the bands is particularly notable because it could lead to a decisive breakout or breakdown, depending on other market factors and trader sentiment.
If Bitcoin breaks below the midline, the next support could be found at the lower Bollinger Band, currently positioned around $51,792, which could represent a significant downturn in price. Conversely, should Bitcoin bounce off the midline and gain upward momentum, it might target the upper Bollinger Band, situated at approximately $76,684, indicating a potential rally.
The analyst points out that understanding the implications of a Bollinger Band Squeeze could be crucial for traders, as such periods of low volatility often end in sharp price moves. “If you didn’t like the Cloud ultimatum, here’s the weekly BBands,” remarked Olszewicz.
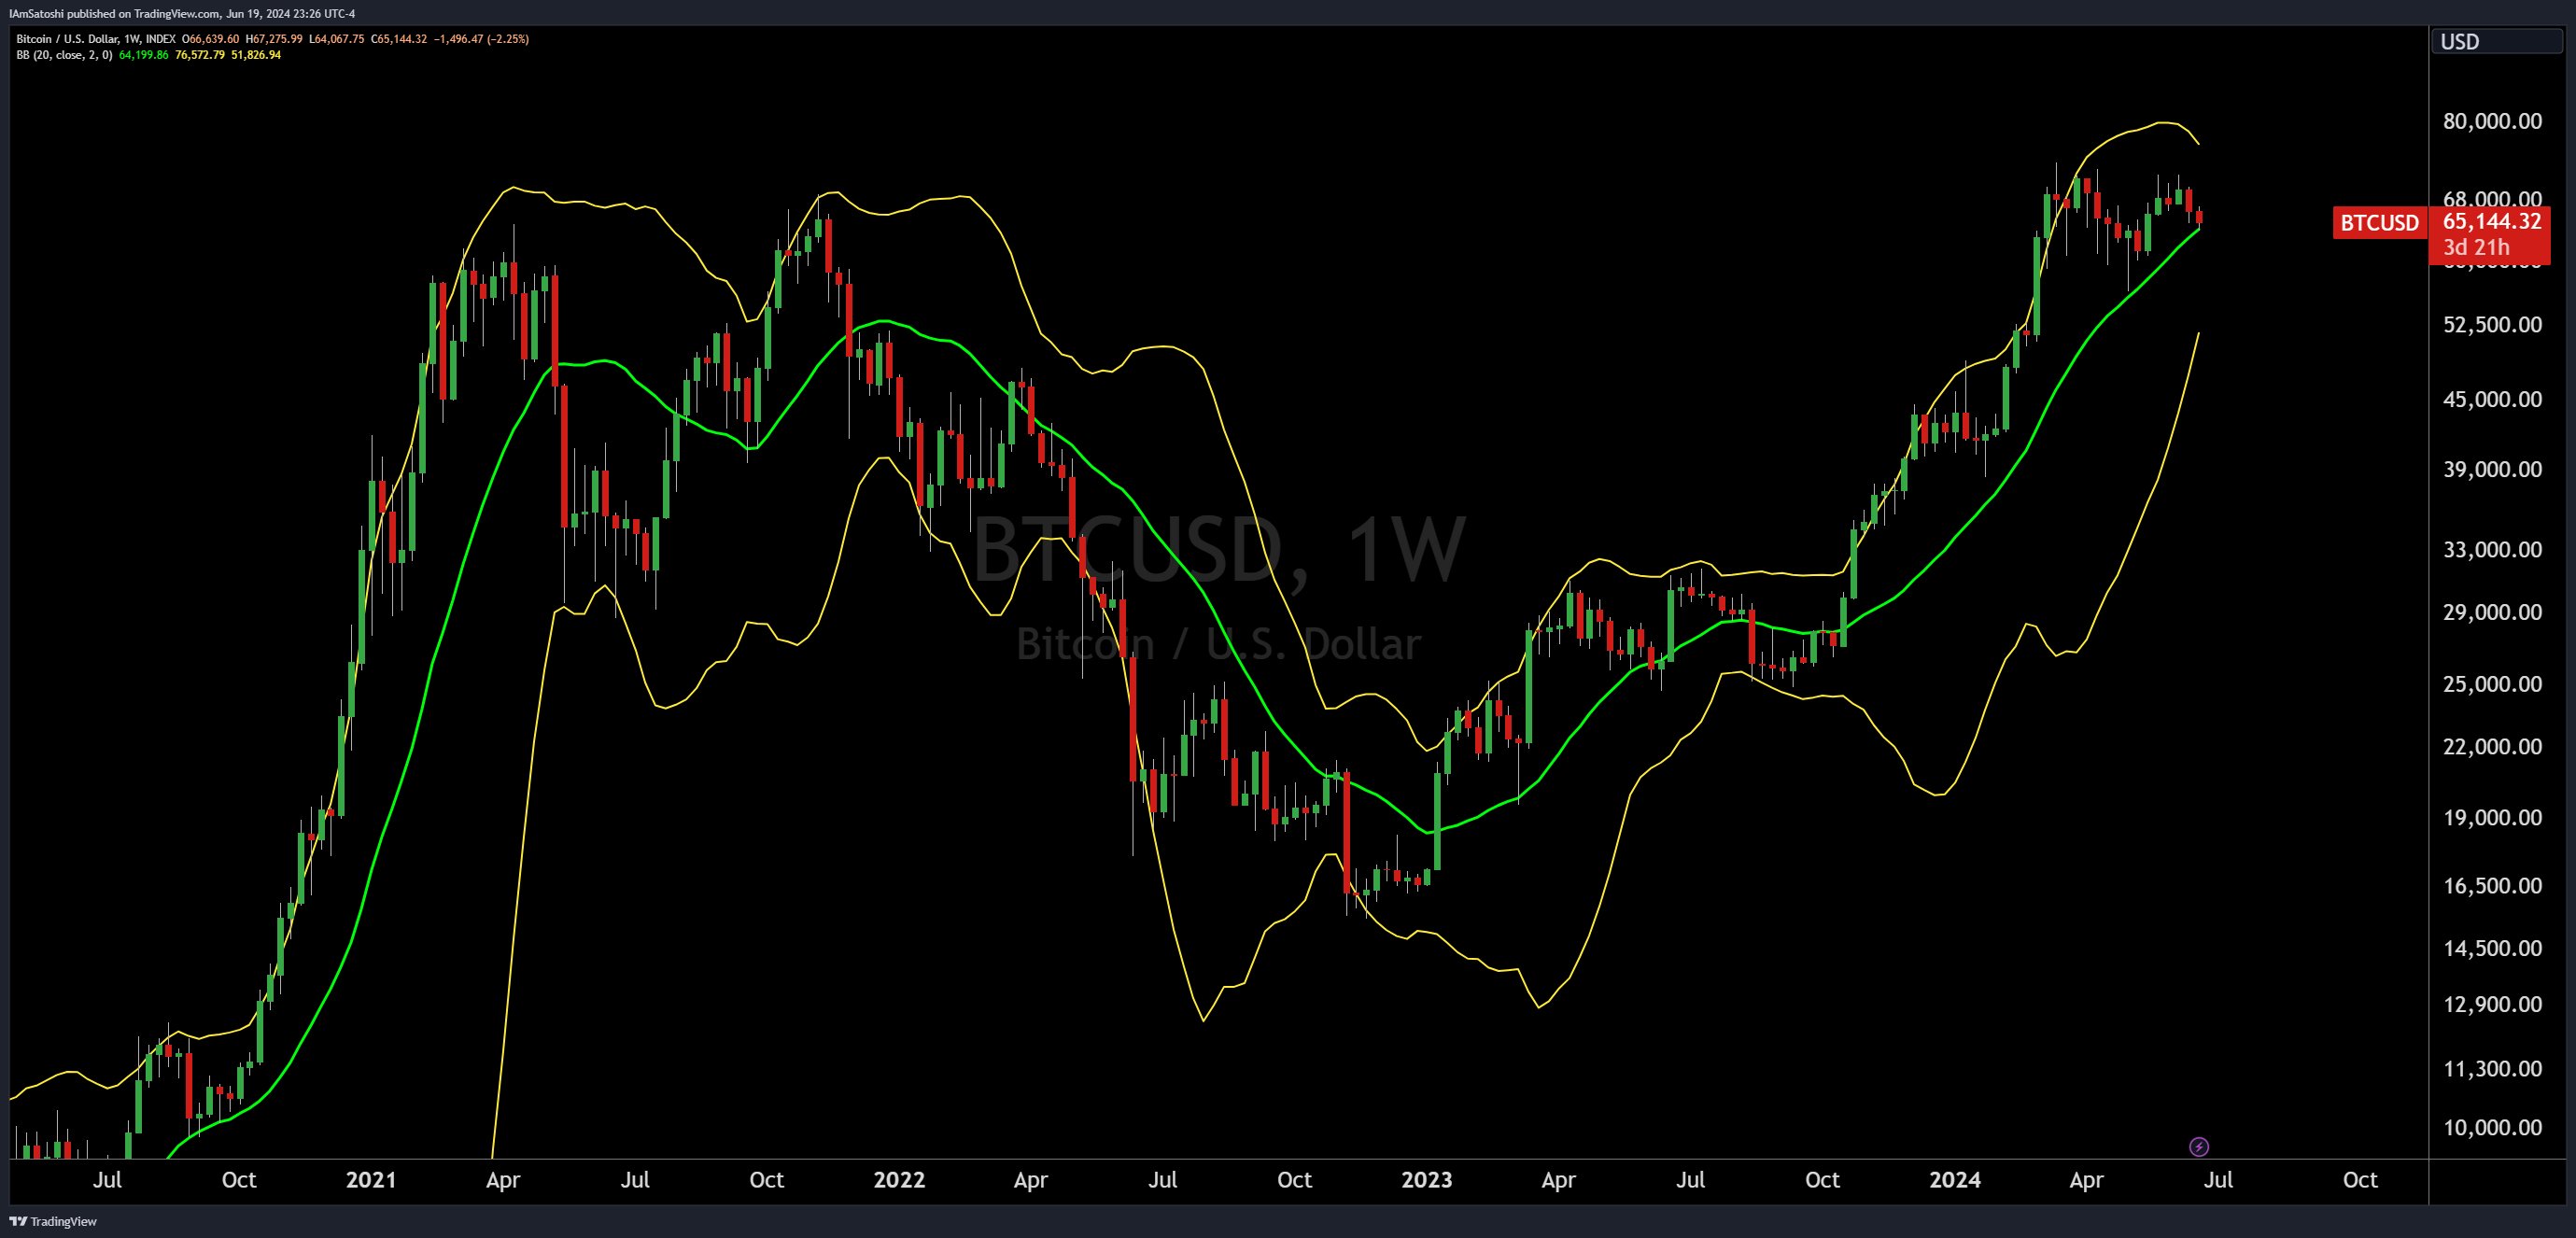
Both charts, though using different analytical tools, converge on a similar narrative: Bitcoin is at a potential turning point that could define its price action for the coming days or weeks. The current levels close to the upper boundaries of both the Ichimoku Cloud and the Bollinger Bands underscore the tension in the market.
At press time, BTC traded at $65,494.