While most crypto novices focus on price fluctuations and try to time trades, advanced investors understand there are dozens of metrics and data that are indispensable for gauging the health and long-term potential of DeFi projects. As the blockchain industry has matured, more tools have been developed for people to analyze on-chain data.
Below are the top 5 types of useful tools grouped by the category of data they can help you understand.
Tools for Analyzing Tokens: CoinGecko & CoinMarketCap
CoinGecko was launched in 2014 and is a powerful data analysis tool focused on blockchain data.
- Key Features
(1) Track DeFi tokens. Tokens are listed by market cap by default, but users can choose other filters. Tokens can be compared by price, trading volume, market cap, and other metrics.
(2) Beginner’s guide. CoinGecko provides a beginner’s guide, a glossary, and news to help you understand the dynamics of crypto.
(3) Visualization of token historical data. Coingecko historical data includes price, market cap, and trading volume, which can be used to determine the data performance of tokens.
- Top Features
(1) Powerful metric filtering options
(2) Data for over 12,500 tokens
(3) Numerous additional features, e.g. NFT board, Beginner’s Guide, news, etc.
 Tools to Analyze DeFi Revenue: Token Terminal
Token Terminal measures DeFi with traditional financial metrics, which makes it more accessible for those entering crypto from a traditional finance background.
- Key Features
(1) Provides standardized metrics to compare the strengths and weaknesses of DeFi projects.
(2) Users can use metrics to determine the value they can get from investing in a project. Such as P/S Ratio, P/E Ratio, and protocol revenue.
- Reasons for Recommendation
(1) Perfect for users with a traditional financial background to evaluate projects as investments.
(2) Over 100 DeFi protocols included. There are more metrics and more options for data quantification.
(3) Data is updated quickly, with an update frequency of top protocols at 4 hours.
Tools Used to Analyze DeFi TVL: DeFiLlama
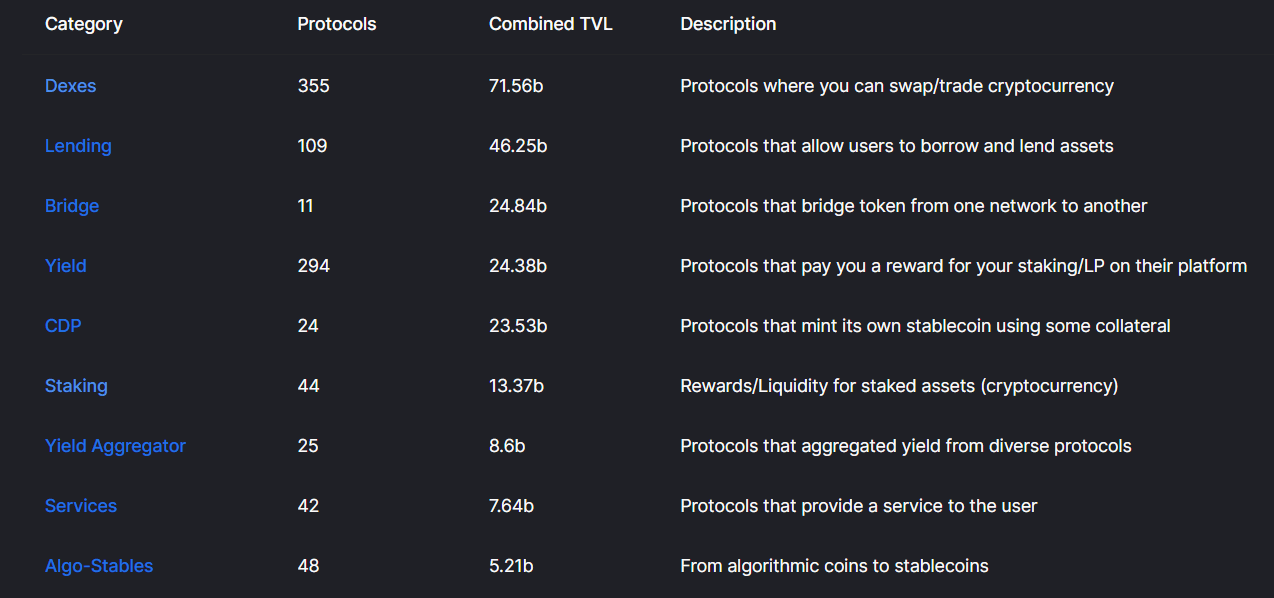
DeFiLlama tracks the TVL of over 800 DeFi protocols. It can be viewed by DEX, Lending, Yield, and other categories. The specific ranking labels are 1d Change, 7d Change, 1m Change, TVL, and MarketCap/TVL.
- Reasons for Recommendation
(1) Track more protocols and categorize them, which is the current first choice for viewing DeFi TVL.
(2) Open the DeFiLlama NFT section to meet the dual needs of DeFi and NFT with one tool.

All-in-one Analysis Tools: Dune Analytics & Footprint Analytics
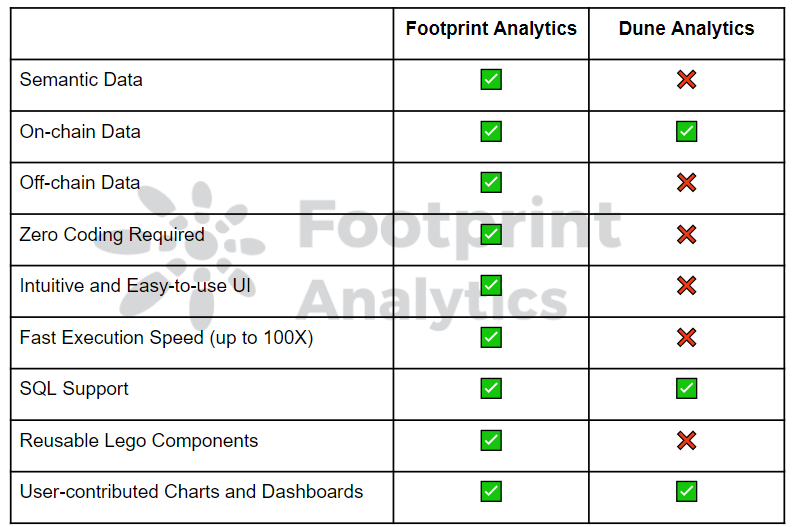
Dune Analytics and Footprint Analytics are similar in function, both providing all-in-one analysis to visualize data.
- For beginners, Footprint is recommended, as it requires zero coding nor SQL skills.
- For someone with a coding background, Dune is recommended. Dune uses SQL to analyze real-time raw data.

Dune Analytics has been around for four years and has data queries for 5 chains. It closed a $69.42 million Series B round in February 2022.
- Reasons for Recommendation
(1) Customization. Query multiple databases with SQL, visualize the results and explore more data analysis for DeFi protocols.
(2) Community sharing. By default, all queries and datasets are public, and users can directly copy others’ Dashboard and use it as a reference. dune also encourages the contribution of queries.
Although Dune is powerful, it is not easy to master because of the SQL.
Footprint Analytics provides an easy-to-use data analytics service. It closed a $1.5 million seed round led by IOSG Ventures in January 2022.
- Reasons for Recommendation
(1) Zero coding is required. Footprint gives users a simple drag-and-drop interface.
(2) One-click bifurcation query. Currently supports 18 data chains for query and 4 chains for drill-down depth analysis.
(3) Simple and easy to analyze data, shield underlying cumbersome and difficult-to-understand raw data.
Tools for Track and Target Whales: Nansen & Glassnode
Nansen was created in 2019 to provide data analysis of on-chain wallet transactions. Even as an all-pay service, it remains very popular. The cumulative funding of over $80 million in less than six months between the Series A and B rounds is evidence of this.
- Key Features
(1)Nansen’s most prominent feature is “smart money”, which tags over 50 million Ethereum wallet addresses. Users can also track Whale accounts.
(2)The Token God Mode feature can parse ERC-20 tokens in all aspects.
- Reasons for Recommendation
The wallet address analysis is very powerful. It can track whales fast, which is ideal for investors who follow whales
Glassnode is another option for tracking whales. Unlike Nasen, which focuses solely on wallet address analysis, Glassnode offers a variety of data analysis services.
- Key Features
(1)Track whales. Help users track and follow whales for investment.
(2)Glassnode alerts. Tracks the dynamics of ERC20s on-chain metrics.
(3)Weekly reports. Help to understand the cryptocurrency market.
In terms of versatility, Glassnode focuses more on overall market research and provides a richer source of data.
Summary
Compared to traditional finance, the cryptocurrency market is relatively open in terms of the amount of data that can be accessed by anybody. Only by analyzing the underlying data can you assess a DeFi project and, for that, you need the right tools.
Date & Author: Feb 29th, 2022, by Grace at Footprint analytics.
What is Footprint Analytics?
Footprint Analytics is an all-in-one analysis platform to visualize blockchain data and discover insights. It cleans and integrates on-chain data so users of any experience level can quickly start researching tokens, projects, and protocols. With over a thousand dashboard templates plus a drag-and-drop interface, anyone can build their own customized charts in minutes. Uncover blockchain data and invest smarter with Footprint.
The post 5 DeFi Data Tools for Analyzing Crypto Projects appeared first on CryptoSlate.


