A quant has explained why the recent retest of a critical support level by Nasdaq may help Bitcoin reverse its own trend.
Nasdaq-100 Has Recently Retested A Critical Support Trendline
As pointed out by an analyst in a CryptoQuant post, Nasdaq-100 is currently above a support line that has historically been important.
Nasdaq-100 (NDX) is a stock market index that includes 102 equity securities issued by 101 of the largest non-financial companies (based on their market caps) listed on the Nasdaq stock exchange.
Here is a chart that shows how this trendline has acted as a bounce in the index’s price over the past decade:
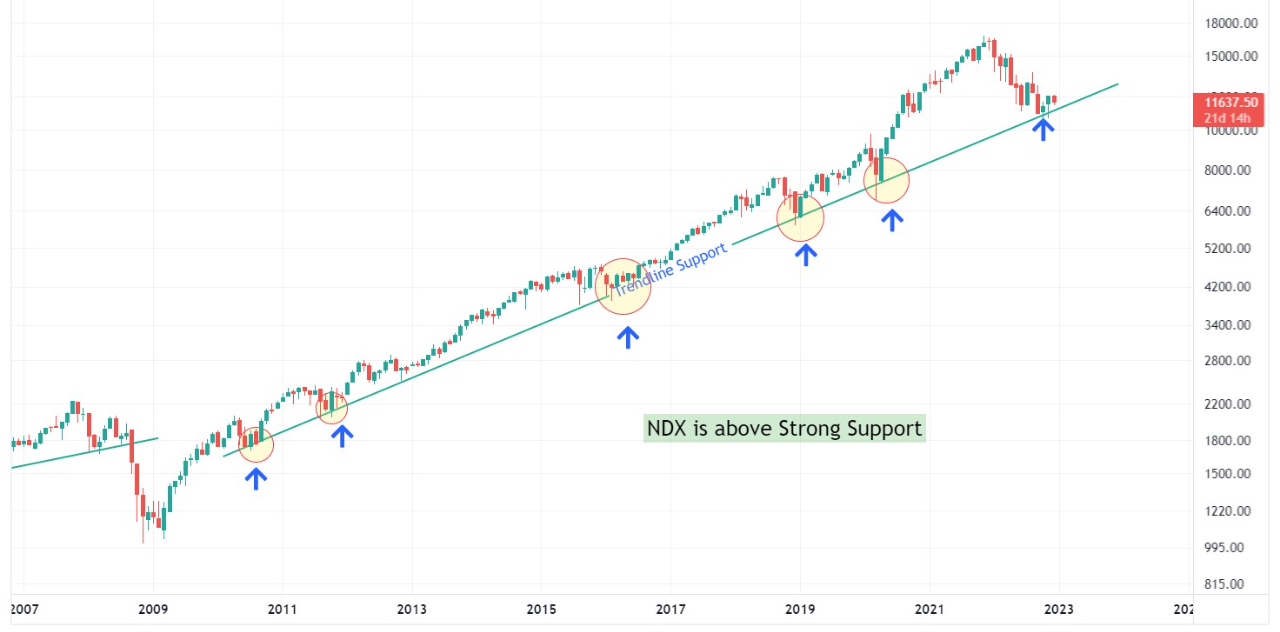
As you can see in the above graph, the price of NDX has been supported five times by this trendline since the year 2010. In each of these instances, the line has put a check on the decline in the index, and has consequently reversed it back up.
Recently, the Nasdaq-100 index has once again made a touch of this trendline, and has so far managed to stay above it.
The quant notes that this retest could have been the end of the latest downwards trend, and might have also been the point of return of a bullish trend.
However, if the trendline is lost instead, it would show the extreme strength of the downtrend, and would suggest that there is more drawdown ahead for the market.
At the same time, Bitcoin has also been testing a support line, as the analyst has highlighted in the chart:
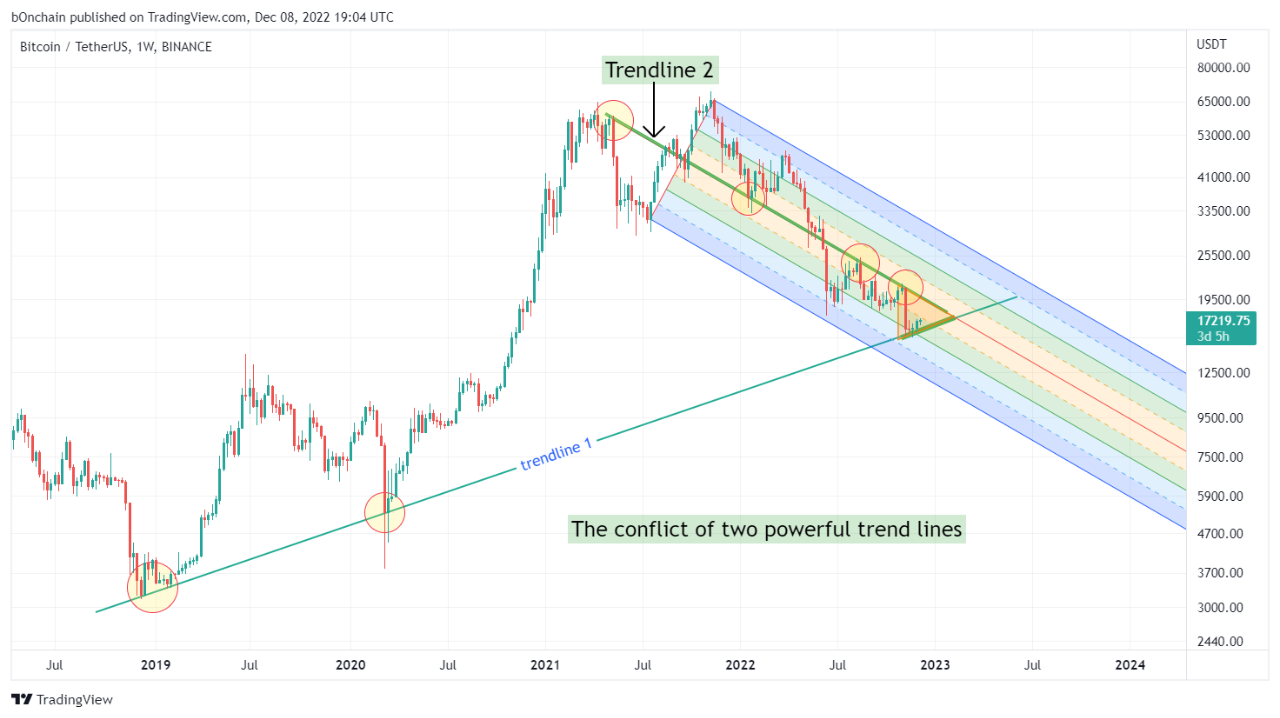
In the past year or so, Bitcoin has shown to be highly correlated with the stock market. The reason behind this correlation has been the rise of institutional investors in the crypto who treat it like a risk asset.
The quant believes that if the current support retest in the stock market proves to be successful, then BTC could also be expected to see a reversal of its own due to its correlation with the stocks.
Bitcoin Price
At the time of writing, Bitcoin’s price floats around $17.2k, up 1% in the last week. Over the past month, the crypto has lost 7% in value.
Below is a chart that shows the trend in the price of the coin over the last five days.


