Data shows the Bitcoin NVT Golden Cross is still in the “overbought” region, a sign that there may be more volatility to come for the cryptocurrency.
Bitcoin NVT Golden Cross Continues To Be At A High Value
As pointed out by an analyst in a CryptoQuant post, the BTC long-term holders have been moving their coins recently. The “NVT ratio” is an indicator that measures the ratio between the Bitcoin market cap and the transaction volume on the chain (both in USD). What this metric tells us is whether the value of the cryptocurrency (the market cap) is comparable to the ability to transact coins or not (the volume).
When the value of the metric is high, it means BTC is overvalued right now as transaction volumes are low compared to the market cap. On the other hand, low values imply the crypto may be undervalued currently.
The “NVT Golden Cross” is an indicator that compares the long-term (30-day MA) and the short-term (10-day MA) trends of the NVT ratio to identify tops and bottoms in the metric. Now, here is a chart that shows the trend in the NVT Golden Cross over the last couple of years:
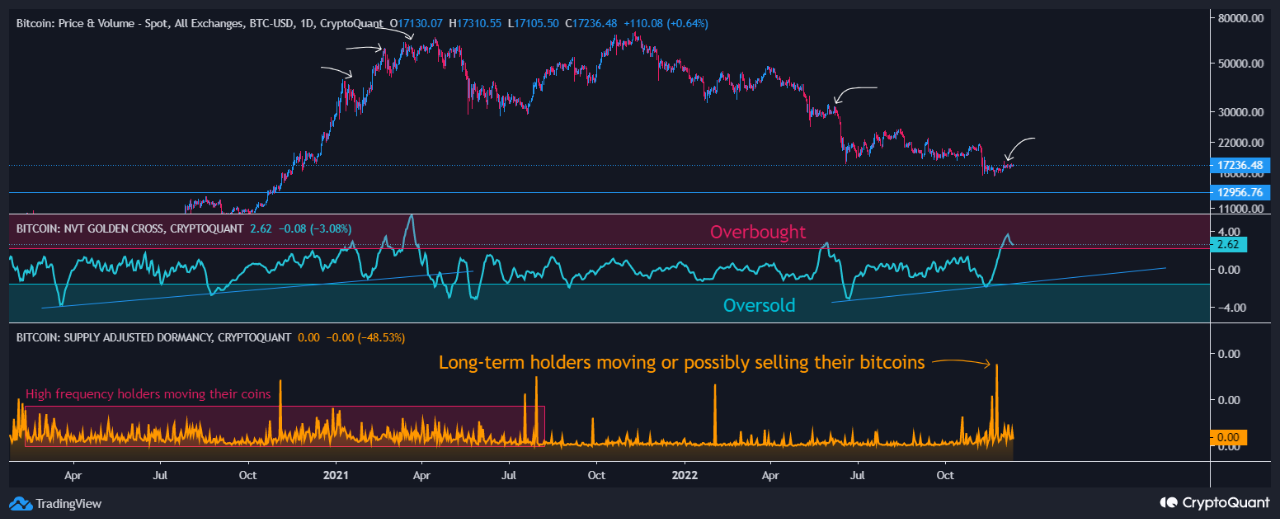
As you can see in the above graph, the quant has marked the “overbought” and “oversold” regions in the Bitcoin NVT Golden Cross. Whenever this metric has a value of more than 2.2, it means the crypto might be overpriced right now. The coin has usually observed a bearish effect when the indicator has been in this region, as the chart displays.
The “underpriced” condition occurs in the zone where the BTC NVT Golden Cross has values less than -1.6. In the image, there is also the chart for the “supply adjusted dormancy,” an indicator that tells us whether long-term holders are selling or not currently.
It seems like the LTHs have been possibly participating in a large degree of selling recently. This metric has an influence on the NVT Golden Cross, which has also risen in the last few weeks. The indicator is now in the overbought region, which suggests Bitcoin may soon be seeing some bearish volatility.
BTC Price
At the time of writing, Bitcoin’s price floats around $17k, down 2% in the last week. Over the past month, the digital asset has gained 1% in value. The chart below shows the trend in the price of the coin over the last five days.


