BNB price (Binance coin) found support near $255 against the US Dollar. BNB is rising and might gain pace if it clears the $285 resistance zone.
- Binance coin price started a recovery wave from the $255 support against the US Dollar.
- The price is now trading below $280 and the 100 simple moving average (4-hours).
- There is a major bearish trend line forming with resistance near $285 on the 4-hours chart of the BNB/USD pair (data source from Binance).
- The pair could start a fresh rally if it clears the $285 and $290 levels.
Binance Coin Price Aims Upside Break
After a steady decline, BNB price settled below the $280 level. It tested the $255 support zone and traded as low as $253.8. Recently, there was a recovery wave above the $260 level, similar to bitcoin and ethereum.
The price climbed above the $265 and $268 resistance levels. There was a clear move above the 23.6% Fib retracement level of the main decline from the $317 swing high to $253 swing low. However, bnb price is still trading below $280 and the 100 simple moving average (4-hours).
On the upside, the $280 and $285 levels are immediate hurdles. There is also a major bearish trend line forming with resistance near $285 on the 4-hours chart of the BNB/USD pair.
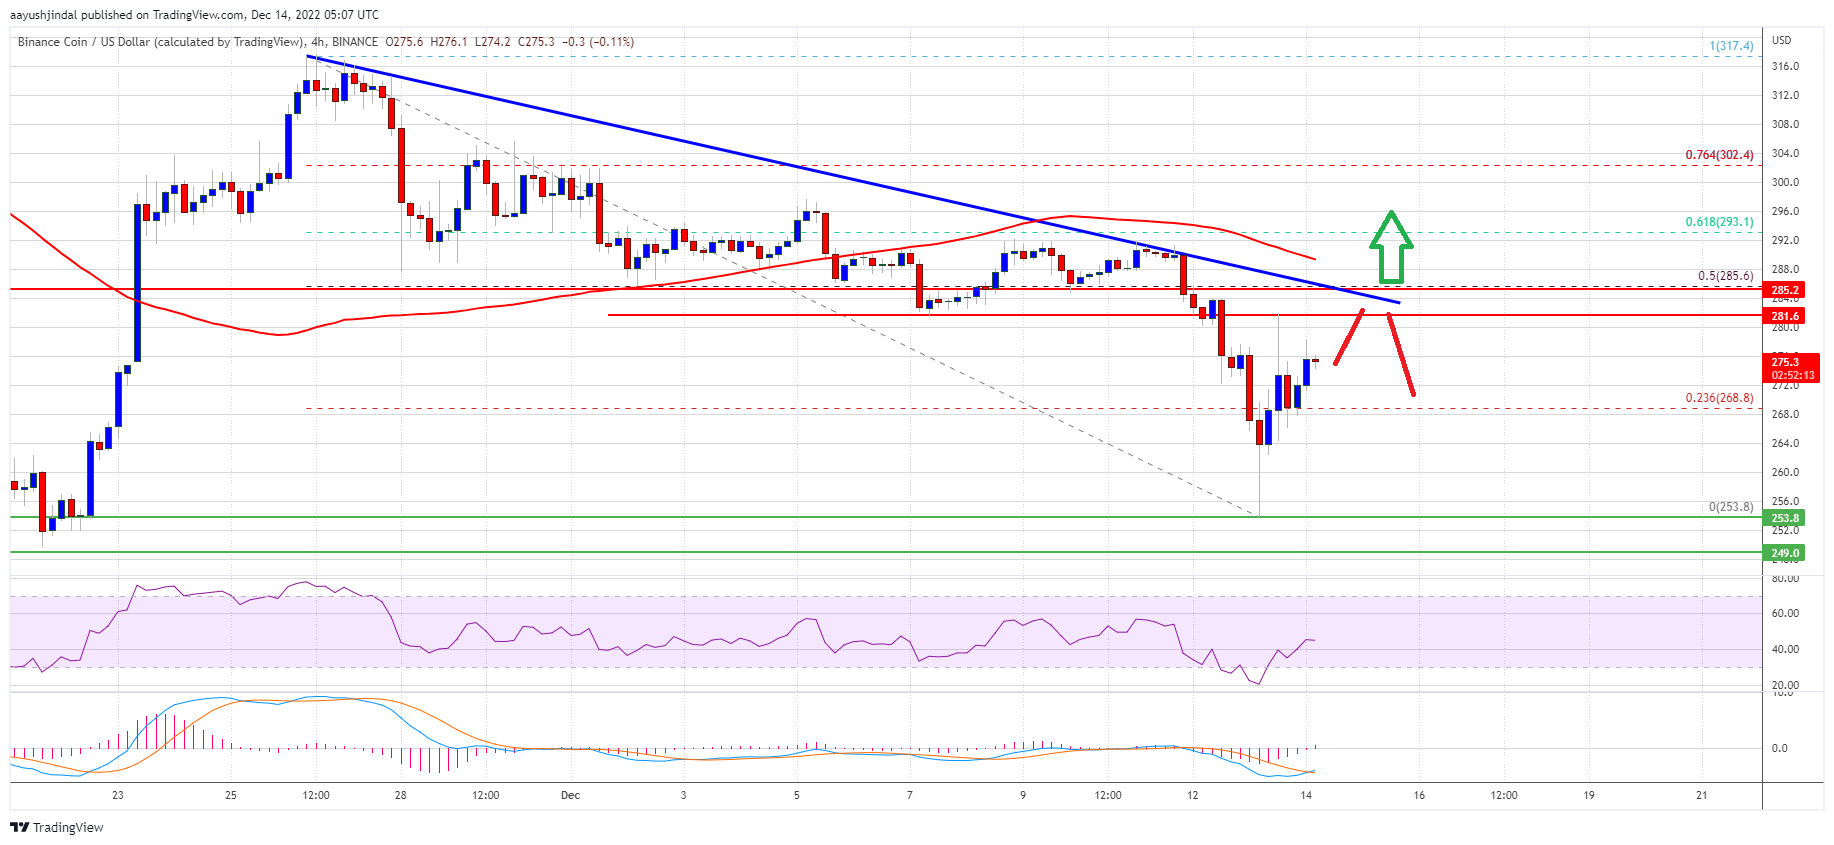
Source: BNBUSD on TradingView.com
The 50% Fib retracement level of the main decline from the $317 swing high to $253 swing low is also near $285. The next major resistance is near the $290 level, above which the price is likely to aim a test of the $320 level in the near term. Any more gains might send the price towards the $350 level.
Fresh Decline in BNB?
If BNB fails to clear the $285 resistance, it could start a fresh decline. An initial support on the downside is near the $268 and $265 levels.
The first major support is near the $260 level. The next major support is near the $255 level. If there is a downside break below the $255 support, there could be an extended decline towards the $225 support.
Technical Indicators
4-Hours MACD – The MACD for BNB/USD is gaining pace in the bullish zone.
4-Hours RSI (Relative Strength Index) – The RSI for BNB/USD is currently near the 50 level.
Major Support Levels – $265, $260 and $255.
Major Resistance Levels – $285, $290 and $320.


