The Shiba Inu price has moved south on its chart over the last 24 hours. In the same time frame, SHIB depreciated by 3%. In the past week, the meme coin also did not register gains, losing a few support lines after losing close to 6% of its market value.
SHIB has now formed a pattern that indicates that the coin might witness a breakout to the upside in the coming 24 hours. The technical outlook still displays bearish signs on the daily chart. Sellers have remained in control of the price for most of this month.
Buyers still have to come to the rescue for SHIB to follow through with an upside breakout. According to the technicals, the coin might fall on its chart over the immediate trading sessions and then move to the upside.
The trading volume of SHIB declined, which supports the notion that buyers have remained low in the market. At the moment, SHIB is trading 90% below its all-time high, which the coin secured almost one year ago.
Shiba Inu Price Analysis: One-Day Chart
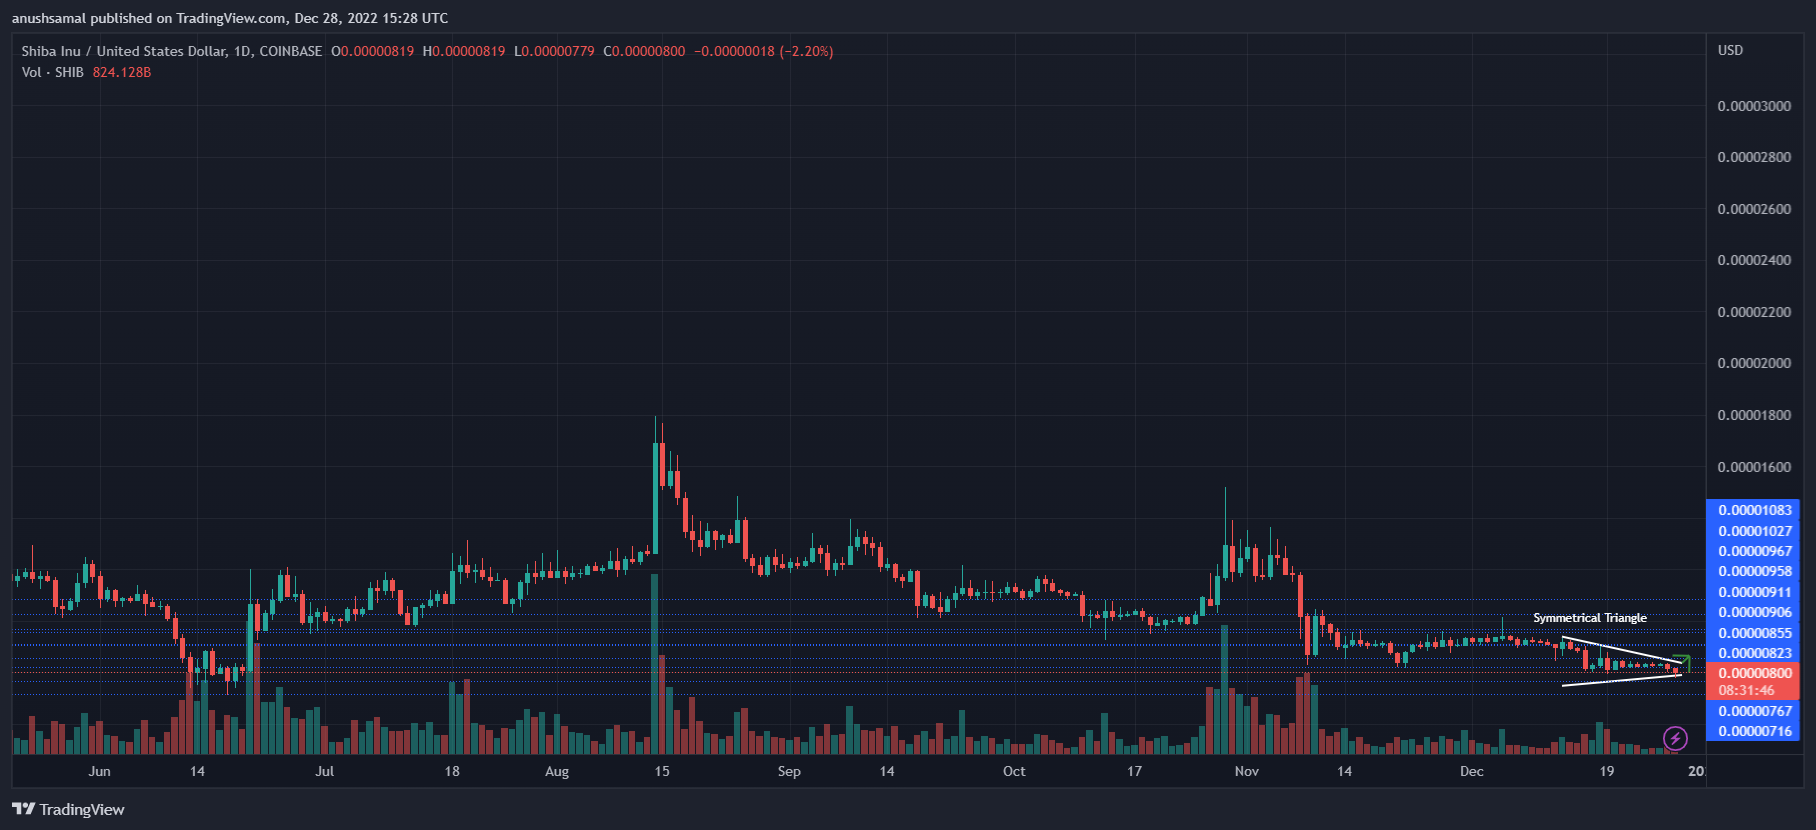
SHIB was exchanging hands at $0.0000080 at the time of writing. Over the past week, the Shiba Inu price fell from the $0.0000082 support line. Shiba Inu is expected to fall below the $0.0000080 level as buying strength remains low.
It has formed a symmetrical triangle pattern which re-affirms that the coin could witness a rally due to a breakout. The first local support stood at $0.0000076, after which the meme coin is expected to break out.
The breakout will cause the Shiba Inu price to rally to $0.00000824, and clearing that resistance will take the coin to $0.0000086. The amount of Shiba Inu traded in the last session declined, which explains why buyers remained low.
Technical Analysis
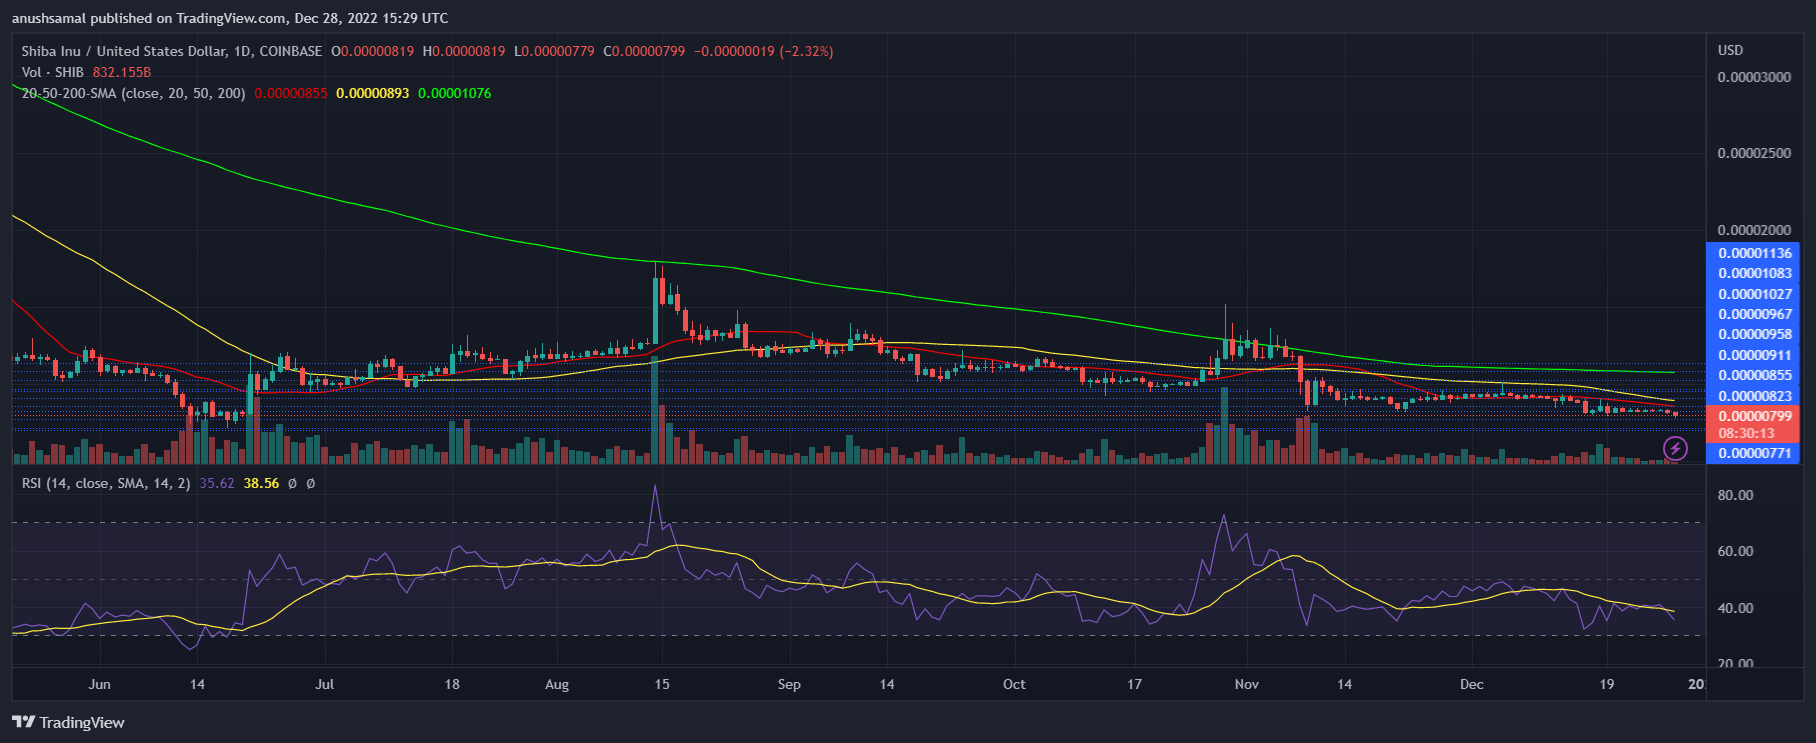
SHIB was in the sellers’ dominance zone for November and December. The Relative Strength Index was below the 40 mark after the recent fall in price. The indicator’s reading displayed that sellers exceeded buyers at press time, indicating bearishness.
On the same note, due to a lack of demand, SHIB traveled below the 20-Simple Moving Average line (SMA), which meant that sellers were driving the price momentum in the market. If SHIB remains above the $0.0000080 mark, the meme coin will move above the 20-SMA.
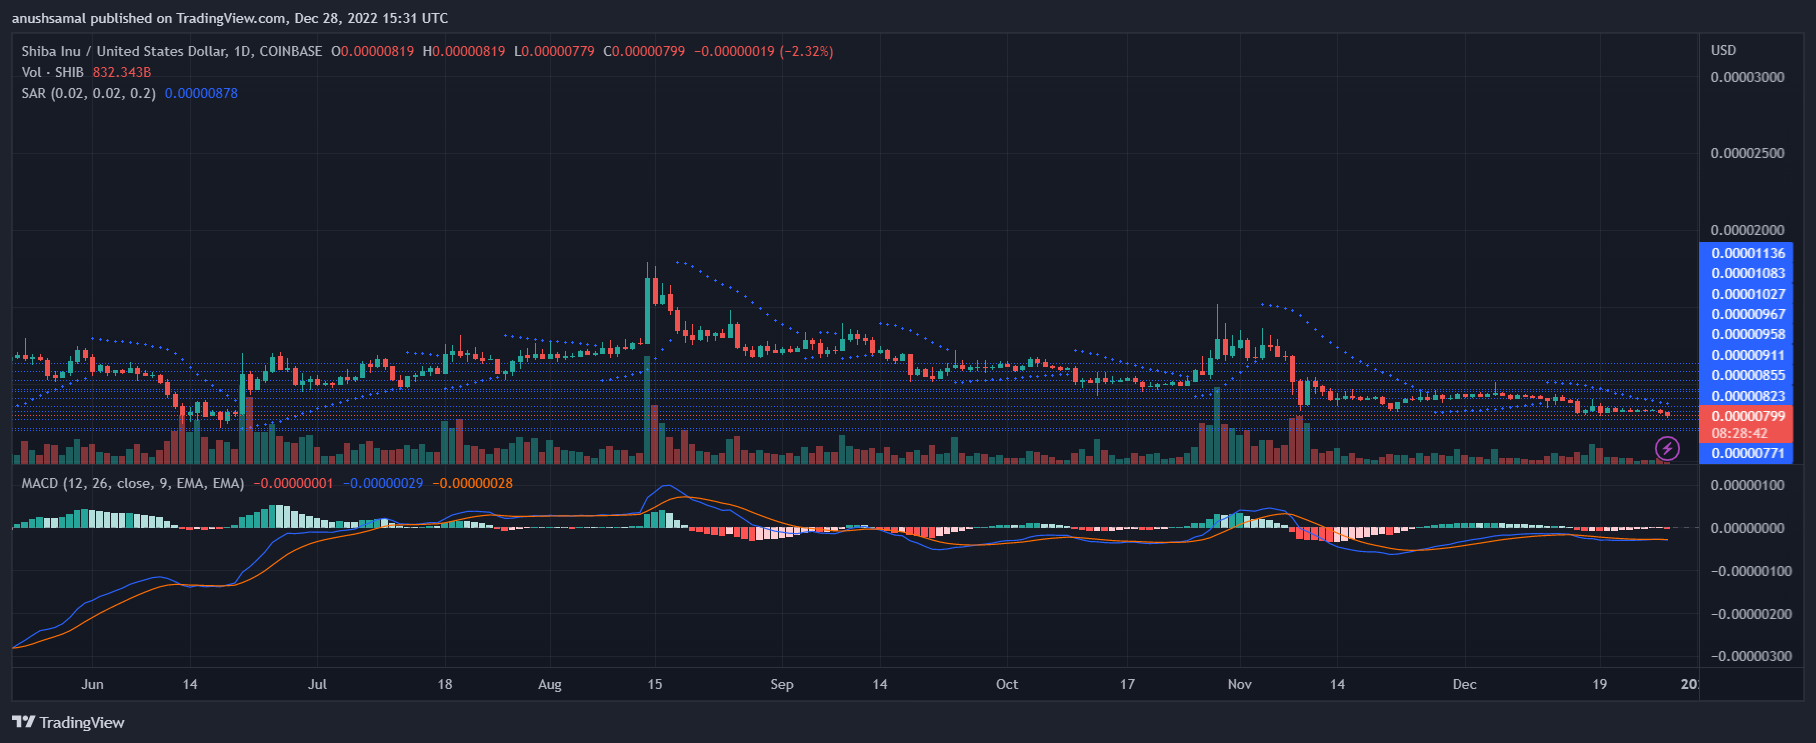
Other technical indicators have also sided with the possibility of SHIB’s value dropping on its chart. The Parabolic SAR demonstrates the price direction and the trend of the asset. The indicator was above the price candlesticks, which indicates that the price is in a continued downtrend.
The Moving Average Convergence Divergence (MACD) presents price momentum and trend reversals. MACD continued to paint red histograms, which meant that this was an indication for traders to sell, as that would mean that the price of SHIB could increase.


