A quant has broken down how the Bitcoin MVRV MACD oscillator could be used to check for signals in the price.
Bitcoin MVRV MACD Oscillator As Price indicator
As explained by an analyst in a CryptoQuant post, this metric can help detect both the lows and the highs in the price, as well as the greater trends. The “Bitcoin MVRV” is an indicator that measures the ratio between the market cap and the realized cap.
Here, the “realized cap” is a capitalization model for BTC that values each coin in circulation at the price at which it was last moved, rather than taking the same current BTC price as the value of all the coins, as the normal market cap does.
Since the realized cap is sort of a “true” value model for the coin, its comparison with the market cap (in the MVRV) can tell us whether the coin is undervalued or overvalued at the moment. When the MVRV is greater than 1, it means BTC is overpriced right now, while having values below the threshold suggests it’s underpriced.
Now, to use MVRV as a trading tool, the quant has taken the MACD oscillator of the indicator. A MACD oscillator is just the difference between the short-term and long-term exponential moving averages (EMA) of the metric in question. Here, these EMAs are the 50-day and the 100-day versions.
The below chart shows how the Bitcoin MVRV MACD can be used for finding tops and bottoms in the price:
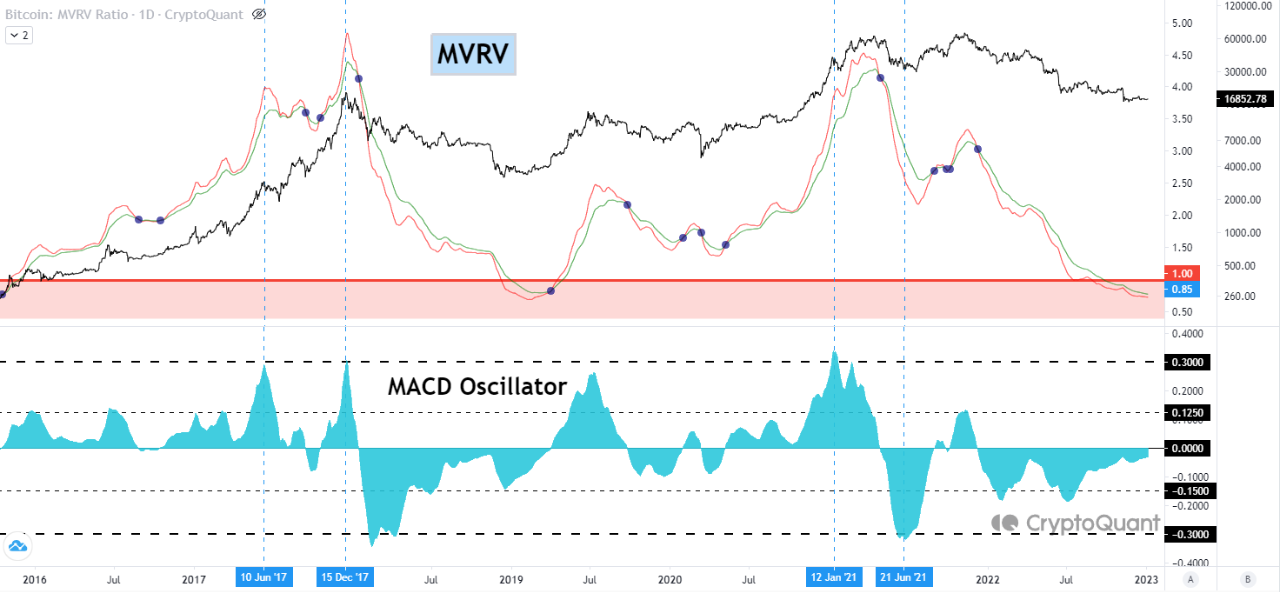
According to the quant, whenever the MVRV MACD has been higher than 0.3, it has been a signal that BTC is overbought currently. On the other hand, values less than -0.3 have signaled underbought conditions.
From the chart, it’s apparent that while these signals haven’t coincided with the cycle tops and bottoms, they have still correctly indicated some local tops and bottoms.
Now, here is another graph where the analyst has highlighted how divergences between the price and the MVRV MACD can signal future trends:
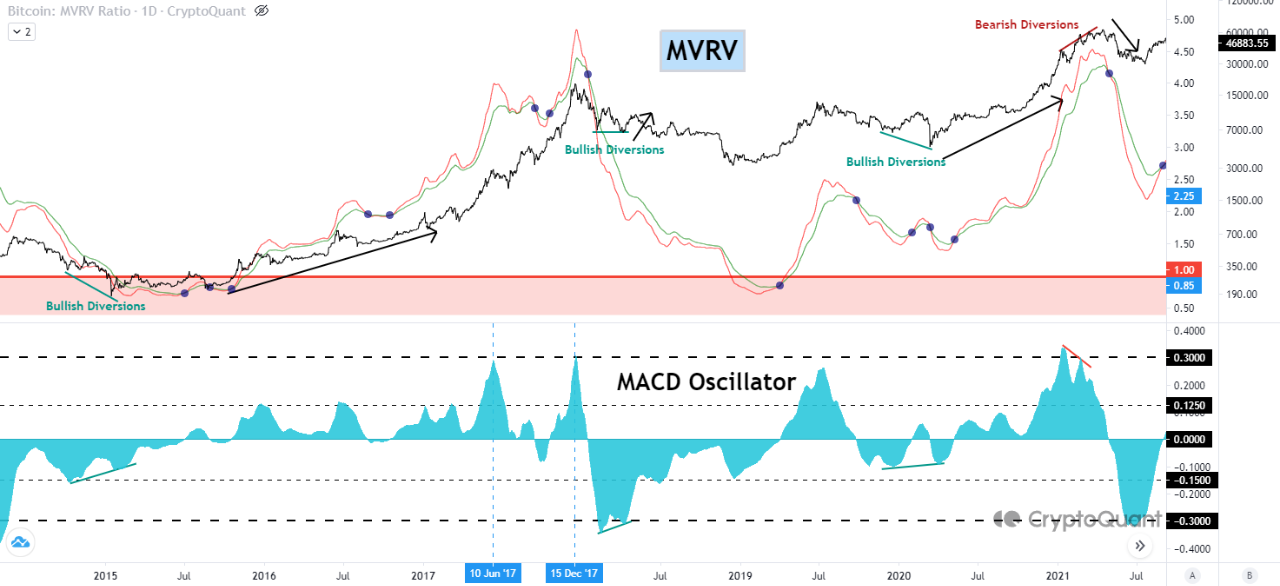
“A divergence occurs when the direction of a technical indicator and the direction of the price trend are moving in opposite directions,” explains the analyst. In the graph, it’s visible that whenever the MVRV MACD has moved up inside the negative region while the price consolidates sideways or declines, a bullish divergence has formed for Bitcoin.
Similarly, a bearish divergence has taken shape when the value of the crypto has been rising, but the indicator has been going down in the zone above zero. At present, none of these signals have formed in the current bear market so far.
BTC Price
At the time of writing, Bitcoin is trading around $16,800, up 1% in the last week.


