Polkadot’s DOT started a fresh increase above the $6.50 resistance against the US Dollar. The price is now correcting gains, but dips might be limited below $6.80.
- DOT is correcting gains from the $7.85 resistance zone against the US dollar.
- The price is trading above the $6.60 support and the 100 simple moving average (4-hours).
- There was a break above a major bearish trend line with resistance near $6.75 on the 4-hours chart of the DOT/USD pair (data source from Kraken).
- The pair could find a strong buying interest near $6.80 and $6.60 in the near term.
Polkadot’s DOT Price Corrects Lower
After forming a base above the $6.00 zone, DOT price started a fresh increase. It climbed above the $6.40 and $6.50 levels to move back into a positive zone.
The bulls were able to push the price above the $6.80 level and the 100 simple moving average (4-hours). Besides, there was a break above a major bearish trend line with resistance near $6.75 on the 4-hours chart of the DOT/USD pair.
The pair traded to a new multi-week high at $7.89 before the bears appeared. The price started a downside correction below the $7.50 level, similar to bitcoin and ethereum. It declined below the 23.6% Fib retracement level of the upward move from the $5.88 swing low to $7.89 high.
However, DOT price is trading above the $6.60 support and the 100 simple moving average (4-hours). An immediate resistance is near the $7.40 level.
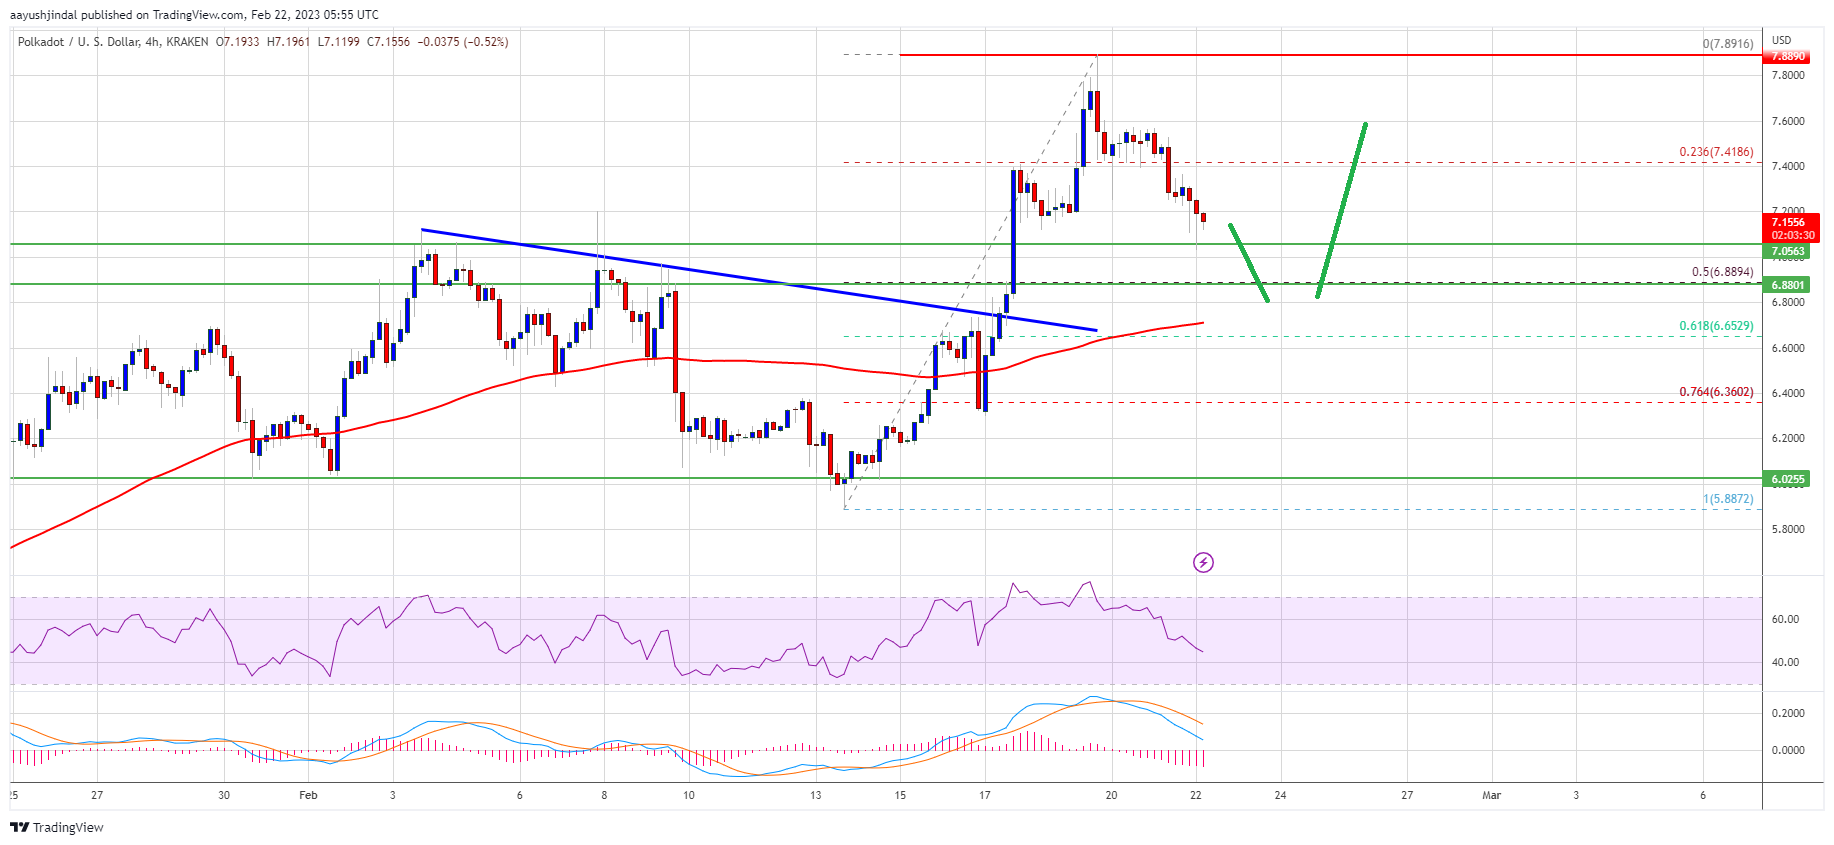
Source: DOTUSD on TradingView.com
The main resistance is near the $7.80 and $7.85 levels. A successful break above $7.80 and a close above $7.80 could start a strong rally. In the stated case, the price could easily rally towards $8.50 or even $9.20 in the coming sessions.
Dips Limited?
If DOT price fails to continue higher above $7.20 or $7.40, it could continue to move down. The first key support is near the $7.00 level. The next major support is near the $6.80 level and the 100 simple moving average (4-hours).
It is close to the 50% Fib retracement level of the upward move from the $5.88 swing low to $7.89 high, below which the price might decline to $6.60. Any more losses may perhaps open the doors for a move towards the $6.00 support zone.
Technical Indicators
4-Hours MACD – The MACD for DOT/USD is now gaining momentum in the bearish zone.
4-Hours RSI (Relative Strength Index) – The RSI for DOT/USD is now below the 50 level.
Major Support Levels – $7.00, $6.80 and $6.60.
Major Resistance Levels – $7.20, $7.40 and $7.80.


