Ethereum price is correcting gains from the $1,780 zone against the US Dollar. ETH must stay above the 100 hourly SMA to start a fresh increase.
- Ethereum started a downside correction from the $1,780 resistance zone.
- The price is trading above $1,600 and the 100 hourly simple moving average.
- There was a break below a key bullish trend line with support near $1,695 on the hourly chart of ETH/USD (data feed via Kraken).
- The pair could take a major hit if there is a downside break below the $1,600 support.
Ethereum Price Corrects Gains
Ethereum price started a downside correction after it failed to clear the $1,800 resistance zone. ETH traded below the $1,700 level to enter a short-term bearish zone, similar to bitcoin.
There was a steady decline below the $1,680 and $1,650 levels. Besides, there was a break below a key bullish trend line with support near $1,695 on the hourly chart of ETH/USD. The pair settled below the 50% Fib retracement level of the upward move from the $1,570 swing low to $1,784 high.
Ether price is still trading above $1,600 and the 100 hourly simple moving average. It is also above the 76.4% Fib retracement level of the upward move from the $1,570 swing low to $1,784 high.
On the upside, the price is facing resistance near the $1,650 zone. The first major resistance is near the $1,665 zone. The next major resistance is near the $1,700 level. A close above the $1,700 resistance zone might start another major increase.
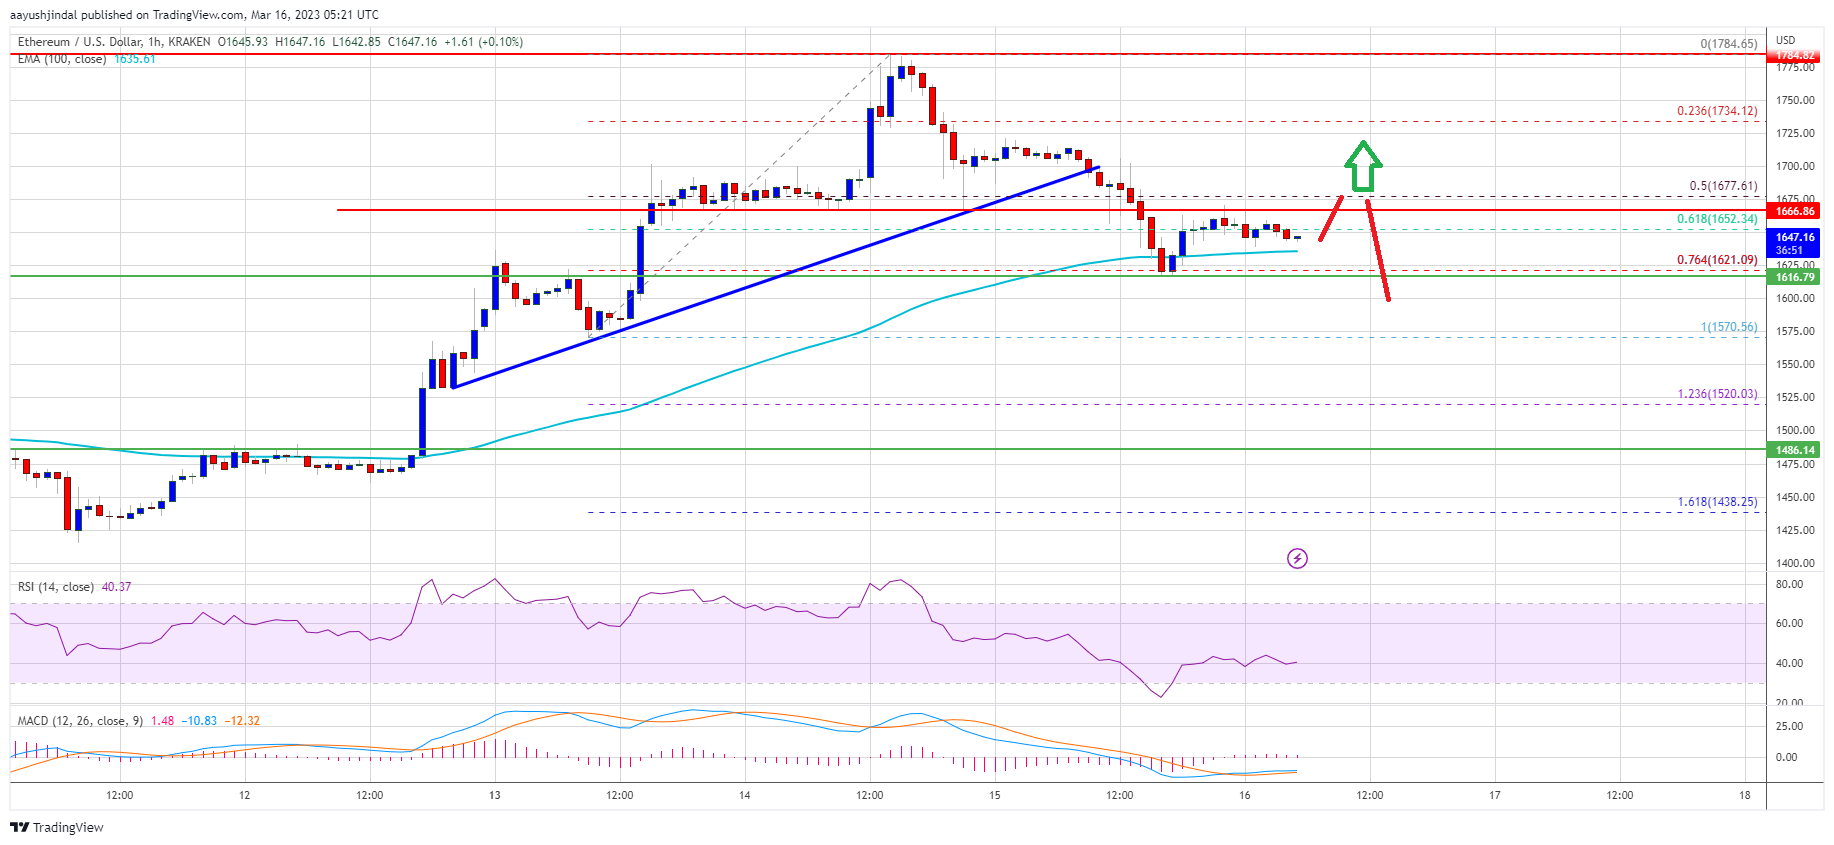
Source: ETHUSD on TradingView.com
In this case, the price may perhaps rise towards the $1,800 resistance level. Any more gains might send the price towards $1,880.
Downside Break in ETH?
If ethereum fails to clear the $1,700 resistance, it could start another decline. An initial support on the downside is near the $1,630 level and the 100 hourly SMA.
The next major support is near the $1,600 zone. If there is a break below $1,600, the price might drop towards $1,550. Any more losses might call for a test of the $1,485 level.
Technical Indicators
Hourly MACD – The MACD for ETH/USD is now losing momentum in the bullish zone.
Hourly RSI – The RSI for ETH/USD is now below the 50 level.
Major Support Level – $1,600
Major Resistance Level – $1,700


