A quant has pointed out parallels between the current and the 2017 Bitcoin cycles, something that may contain hints about what’s next for the asset.
The Current Bitcoin Cycle Has Shown Interesting Parallels With The 2017 Cycle
As explained by an analyst in a CryptoQuant post, there have been five interesting recent events in the current cycle that are similar to what was seen in the 2017 cycle.
The 2017 cycle hit its top in December of that year, while the current cycle hit its top back in November of 2021. The entirety of these cycles isn’t relevant in the context of the current discussion; only the bearish trends that followed after their respective highs were attained.
Related Reading: Bitcoin Circulation Rate Remains Low, Why This Could Be Bad For Rally
The below chart shows the trend in the percentage drawdowns that were seen following the tops in the 2017 and 2021 Bitcoin cycles:
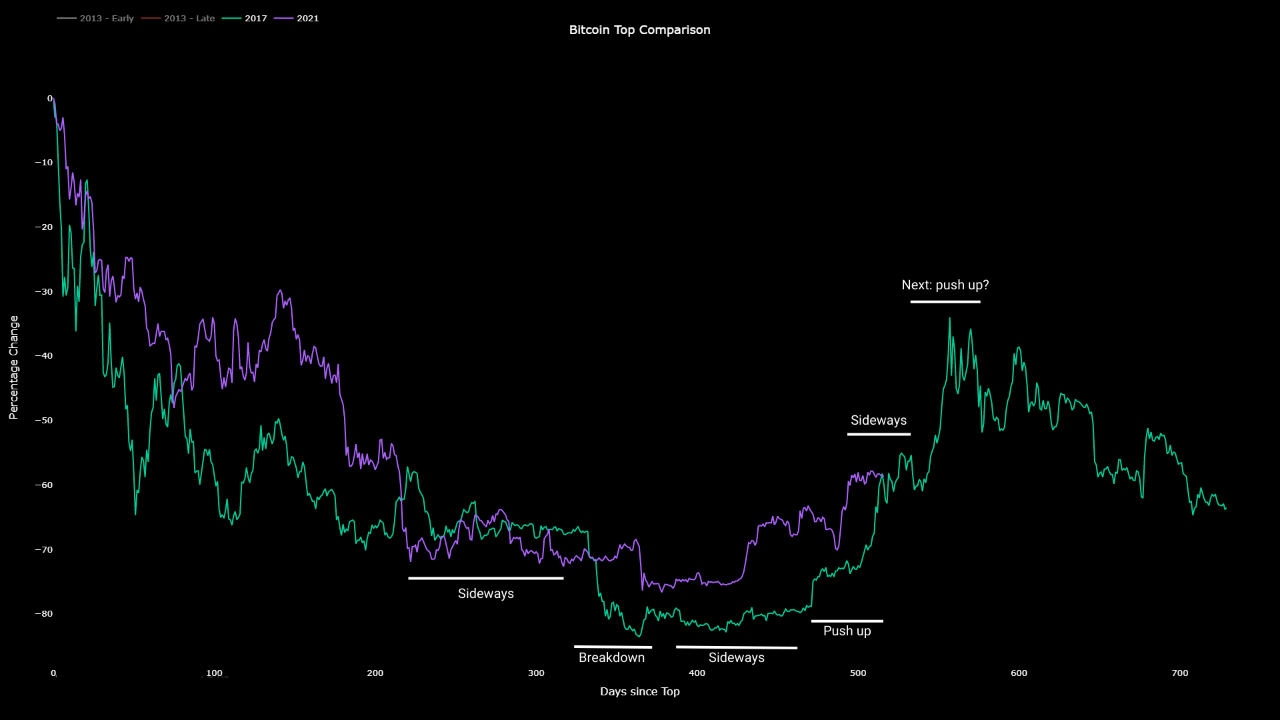
As you can see in the graph, the quant has marked some of the relevant portions of the cycles that were similar between them. In both of these cycles, the price first observed a bear market phase where the asset endlessly consolidated. In the case of the 2017 cycle, the sideways movement was around the $6,000 level, while for 2021, it was about the $20,000 mark.
Both these consolidation periods ended with the price seeing a sharp plunge. Assuming that the lows after the FTX crash back in November 2022 were the worst this bear market is going to get, then the similar sharp plunges in these cycles also lead to bear bottoms for both of them.
After these lows, the price again took to sideways movement in both the 2017 and 2021 cycles. In the 2017 cycle, the price followed up this period with sharp bullish momentum in the form of the April 2019 rally. The current cycle also seems to be showing something similar in the form of the rally that started earlier this year.
Bitcoin hit a roadblock midway through the April 2019 rally and slumped into a sideways consolidation phase again. The quant believes that this is the phase the current cycle is in right now, as BTC’s price action has been quite stale recently.
The X-axis of the graph shows the number of days since the top that these events took place in these cycles. It’s interesting how close the cycles have seemingly been in not just the structure, but also the timing of the events.
If the parallels between these two Bitcoin cycles will continue to hold in the future, then the current sideways trend may be followed by a sharp rise in the price, as the April 2019 rally also followed up its sideways phase with a strong uptrend.
BTC Price
At the time of writing, Bitcoin is trading around $28,300, up 1% in the last week.


