Solana is struggling below the $23 resistance against the US Dollar. SOL price could decline again if there is a clear move below the $20 support.
- SOL price is showing bearish signs below the $23 barrier against the US Dollar.
- The price is now trading below $22.50 and the 100 simple moving average (4 hours).
- There is a key bearish trend line forming with resistance near $22.30 on the 4-hour chart of the SOL/USD pair (data source from Kraken).
- The pair could start a decent increase if it clears the trend line and then $23.
Solana Price Faces Resistance
This past week, Solana’s price saw a steady decline from well above the $24 level, similar to Bitcoin and Ethereum. SOL declined below the $23 and $22 levels to move into a bearish zone.
It even spiked below the $20.50 support. A low is formed near $20.39 and the price is now consolidating losses. It is trading below $22.50 and the 100 simple moving average (4 hours). There is also a key bearish trend line forming with resistance near $22.30 on the 4-hour chart of the SOL/USD pair.
On the upside, immediate resistance is near the $21.75 level. It is close to the 23.6% Fib retracement level of the downward move from the $26.03 swing high to the $20.39 low.
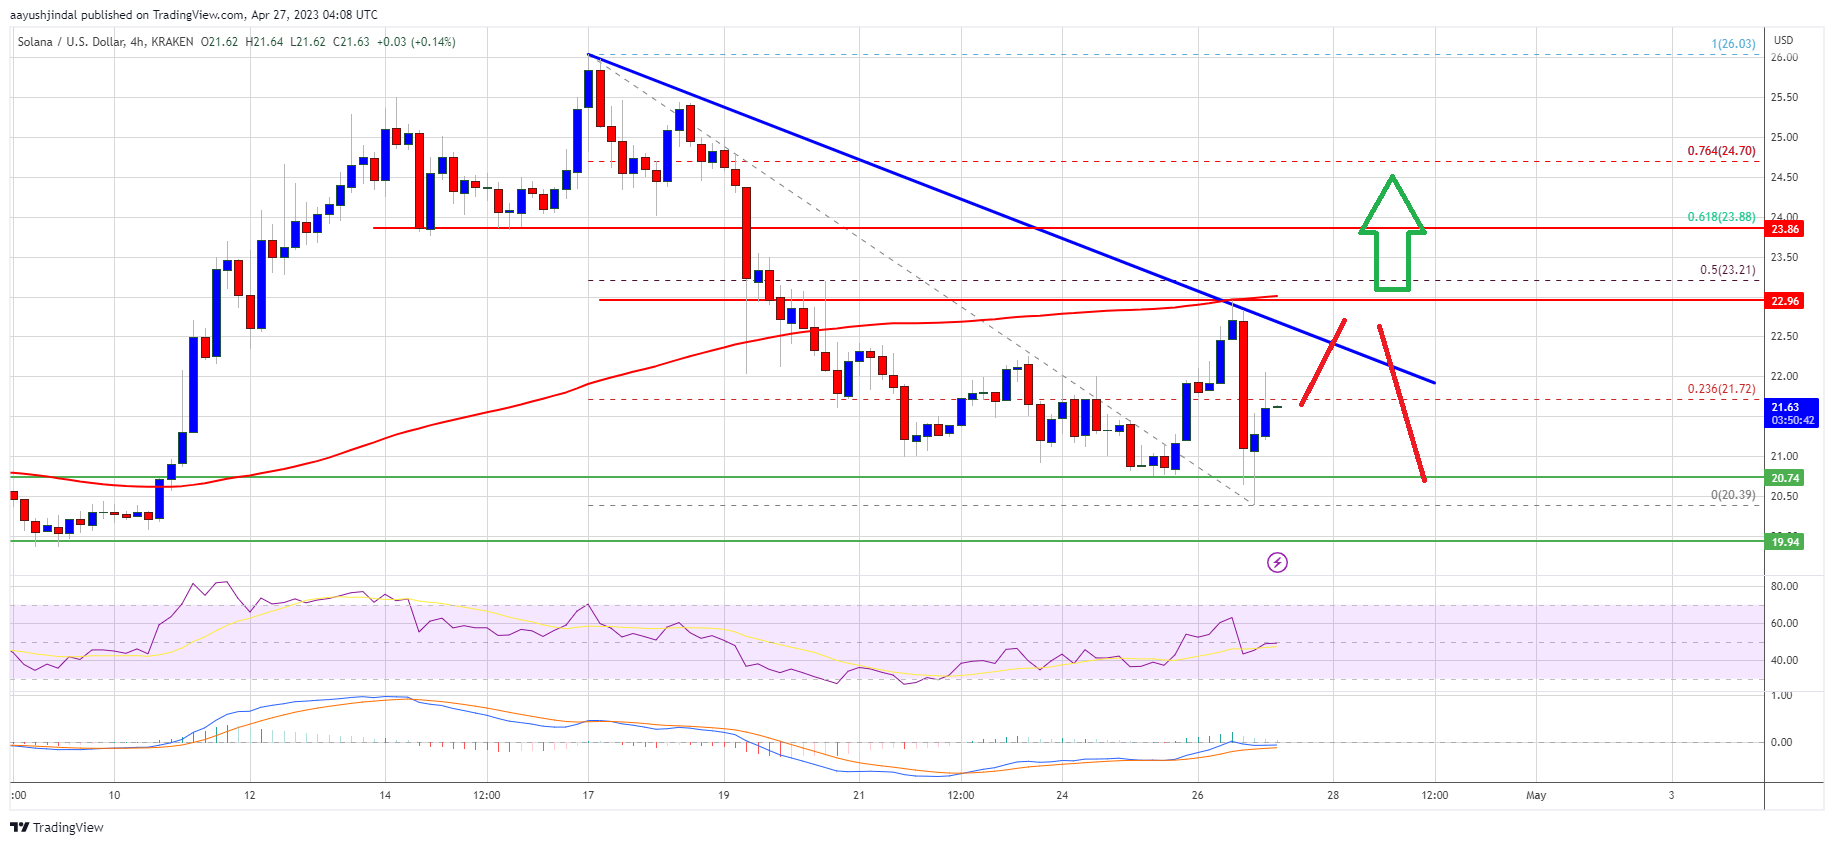
Source: SOLUSD on TradingView.com
The next major resistance is near the trend line, above which the price could gain bullish momentum and rise toward the $23 resistance or the 50% Fib retracement level of the downward move from the $26.03 swing high to the $20.39 low. Any more gains might send the price toward the $25 level.
Fresh Decline in SOL?
If SOL fails to clear the $23 resistance, it could start a fresh decline. Initial support on the downside is near the $21.00 level.
The first major support is near the $20 level, below which the bears might gain strength. In the stated case, the price may perhaps decline toward the $18.80 support in the coming days. The next major support is near the $18 level.
Technical Indicators
4-Hours MACD – The MACD for SOL/USD is losing pace in the bullish zone.
4-Hours RSI (Relative Strength Index) – The RSI for SOL/USD is near the 50 level.
Major Support Levels – $21.00, $20.00, and $18.80.
Major Resistance Levels – $22.30, $23, and $25.


