Solana is gaining pace above the $35 resistance against the US Dollar. SOL price remains supported and might aim for a fresh rally toward $38.
- SOL price started a major rally above the $32 resistance against the US Dollar.
- The price is now trading above $35 and the 100 simple moving average (4 hours).
- There is a key bullish trend line forming with support near $33.30 on the 4-hour chart of the SOL/USD pair (data source from Kraken).
- The pair is up nearly 10% and might surge further toward the $38 resistance.
Solana Price Rallies 10%
After a decent upward move, Solana settled above the $30 pivot level. SOL gained bullish momentum after it formed a base above the $30 and $32 levels.
It is now outperforming Bitcoin and Ethereum. There was a clear move above the $35 resistance zone. A new multi-week high is formed near $36.48 and the price is now consolidating gains above the 23.6% Fib retracement level of the upward move from the $32.34 swing low to the $36.48 high.
SOL is now trading above $35 and the 100 simple moving average (4 hours). There is also a key bullish trend line forming with support near $33.30 on the 4-hour chart of the SOL/USD pair.
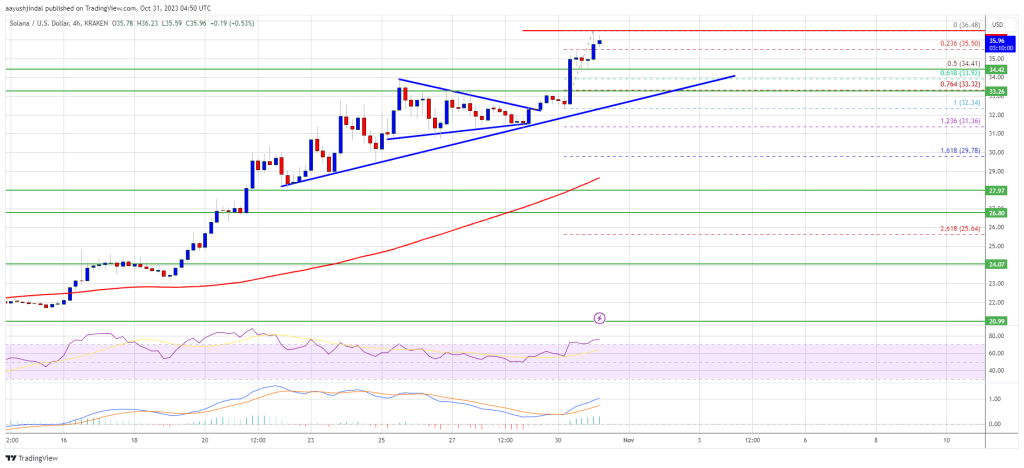
Source: SOLUSD on TradingView.com
On the upside, immediate resistance is near the $36.50 level. The first major resistance is near the $36.80 level. A successful close above the $36.80 resistance could set the pace for a larger increase. The next key resistance is near $38.00. Any more gains might send the price toward the $40.00 level.
Are Dips Limited in SOL?
If SOL fails to recover above the $36.50 resistance, it could start a downside correction. Initial support on the downside is near the $34.40 level.
The first major support is near the $33.30 level, the trend line zone, and the 76.4% Fib retracement level of the upward move from the $32.34 swing low to the $36.48 high. If there is a close below the $33.30 support, the price could decline toward the $32.00 support in the near term.
Technical Indicators
4-Hours MACD – The MACD for SOL/USD is gaining pace in the bullish zone.
4-Hours RSI (Relative Strength Index) – The RSI for SOL/USD is above the 50 level.
Major Support Levels – $34.40, and $33.30.
Major Resistance Levels – $36.50, $36.80, and $38.00.


