Ethereum price is moving lower from $2,130. ETH is showing a few bearish signs and might decline toward the $1,920 support zone.
- Ethereum is slowly moving lower below the $2,060 zone.
- The price is trading below $2,060 and the 100-hourly Simple Moving Average.
- There is a major bearish trend line forming with resistance near $2,040 on the hourly chart of ETH/USD (data feed via Kraken).
- The pair could continue to move down toward the $1,920 support zone.
Ethereum Price Extends Decline
Ethereum price started a fresh decline after it struggled near $2,130. ETH formed a high at $2,132 and started a downward movement. There was a move below the $2,100 and $2,080 levels, like Bitcoin.
The price even spiked below the $2,000 support. A low was formed near $1,986 and the price is now consolidating losses. There was a minor recovery wave above the $2,020 level. Ether climbed above the 23.6% Fib retracement level of the recent drop from the $2,132 swing high to the $1,986 low.
Ethereum is now trading below $2,060 and the 100-hourly Simple Moving Average. On the upside, the price is facing resistance near the $2,040 zone. There is also a major bearish trend line forming with resistance near $2,040 on the hourly chart of ETH/USD.
The first key resistance is near the $2,060 level or the 50% Fib retracement level of the recent drop from the $2,132 swing high to the $1,986 low. The next resistance sits at $2,100. A clear move above the $2,100 level could send the price toward the $2,135 resistance zone.
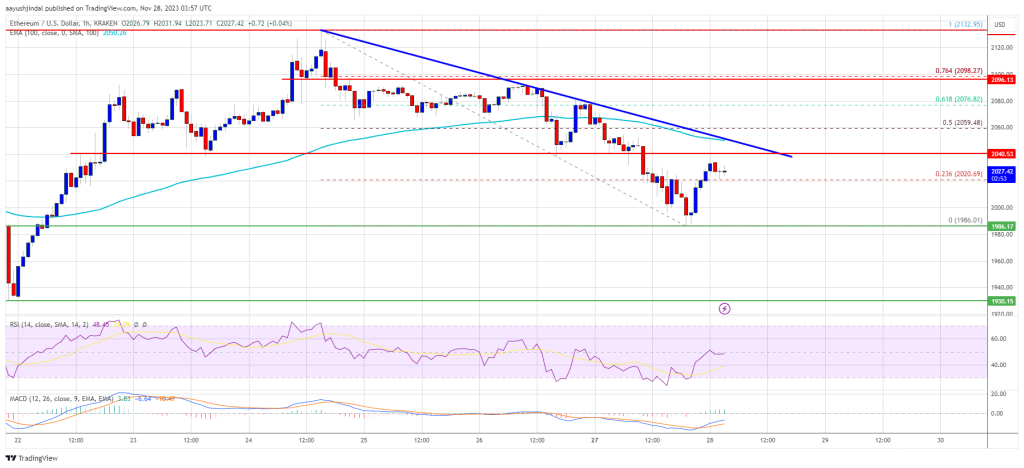
Source: ETHUSD on TradingView.com
The next resistance is near $2,150, above which the price could aim for a move toward the $2,200 level. Any more gains could start a wave toward the $2,250 level.
More Losses in ETH?
If Ethereum fails to clear the $2,040 resistance, it could start a fresh decline. Initial support on the downside is near the $2,000 level.
The next key support is $1,985. A downside break below $1,985 might send Ether toward the $1,920 support. The key support is now at $1,885, below which there is a risk of a move toward the $1,820 level.
Technical Indicators
Hourly MACD – The MACD for ETH/USD is losing momentum in the bullish zone.
Hourly RSI – The RSI for ETH/USD is now below the 50 level.
Major Support Level – $1,985
Major Resistance Level – $2,040


