Menu

Categories:

Hot right now:

Follow on:

Coinsurges provides coverage of fintech, blockchain, and Bitcoin, delivering the most recent news and analyses on the future of money. Stay up-to-date with live prices, charts, and trading options for the top exchanges. Keep track of the day's top cryptocurrency gainers and losers, as well as which coins have experienced gains and losses in the past 24 hours.
Trust Coinsurges as your go-to source for all news and updates in the industry.

SOL Price Pops 10%, Can Solana Bulls Regain Strength?

Share This Post

Solana started a recovery wave from the $120 zone. SOL price is rising and might accelerate higher if there is a close above the $142 resistance.

  • SOL price recovered higher and tested the $140 resistance against the US Dollar.
  • The price is now trading below $142 and the 100 simple moving average (4 hours).
  • There was a break above a key bearish trend line with resistance at $132 on the 4-hour chart of the SOL/USD pair (data source from Kraken).
  • The pair could start another decline if it stays below $142 and $150.

Solana Price Faces Resistance

Solana price extended losses below the $150 and $140 support levels. SOL tested the $120 zone and recently started an upside correction, like Bitcoin and Ethereum.

There was a decent increase above the $125 and $130 levels. The price climbed above the 23.6% Fib retracement level of the downward wave from the $160 swing high to the $118 low. There was a break above a key bearish trend line with resistance at $132 on the 4-hour chart of the SOL/USD pair.

It even spiked above the $140 zone and the 100 simple moving average (4 hours), but there is no hourly close. The bears are currently active near the 50% Fib retracement level of the downward wave from the $160 swing high to the $118 low.

SOL Price

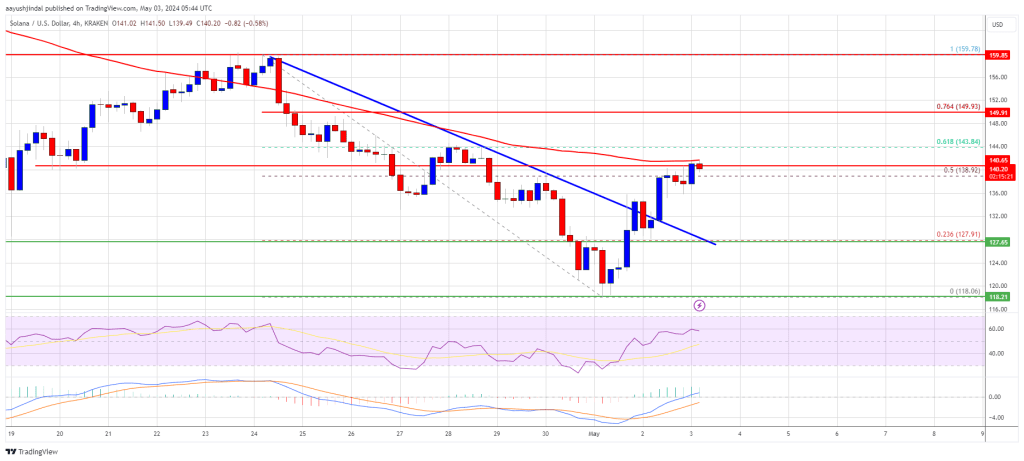
Source: SOLUSD on TradingView.com

Solana is now trading below $142 and the 100 simple moving average (4 hours). Immediate resistance is near the $142 level. The next major resistance is near the $150 level. A successful close above the $150 resistance could set the pace for another major increase. The next key resistance is near $160. Any more gains might send the price toward the $175 level.

Another Decline in SOL?

If SOL fails to rally above the $142 resistance, it could start another decline. Initial support on the downside is near the $132 level.

The first major support is near the $128 level, below which the price could test $120. If there is a close below the $120 support, the price could decline toward the $105 support in the near term.

Technical Indicators

4-Hours MACD – The MACD for SOL/USD is gaining pace in the bullish zone.

4-Hours RSI (Relative Strength Index) – The RSI for SOL/USD is above the 50 level.

Major Support Levels – $132, and $128.

Major Resistance Levels – $142, $150, and $175.

Read Entire Article
spot_img
- Advertisement -spot_img

Related Posts

Solana At A Crossroads: Consolidation Before The Next Major Surge?

In a recent update on X, analyst GemXBT highlighted that Solana (SOL) is moving within a consolidation phase, with the price hovering near the $147 level The pattern indicates that SOL is coiling up,

Robert Kiyosaki Warns Global Panic Is Spreading, the Crash Is Just Beginning

Robert Kiyosaki sounds the alarm on global panic, asking if bitcoin dropped to $300, would you cry or celebrate—urging action before the financial crash hits Robert Kiyosaki Sounds Alarm on

Bitcoin short term realized volatility drops to 16% after early April spike

Bitcoin’s volatility curve saw a sharp swing in April Realized volatility measures the actual day-to-day variability in Bitcoin’s price over a set window instead of the market’s

Solana Monthly Candle Reclaims Key Levels – Is $240 The Next Target?

Solana has held strong above the $145 level, maintaining a bullish structure despite recent market volatility However, bulls have failed to push decisively above the $155 resistance zone, a key level

Investors increase crypto allocations to yearly highs, Bitcoin leads the accumulation

Investor portfolio allocations to crypto have reached a yearly high of 18% as of April 29, according to a recent report published by CoinShares  The report attributed the increase to recent price

Fed Liquidity or Bust: Veteran Investor Sees Inflation Roaring Back to 9%

A Federal Reserve survey naming the trade war and US debt as the economy’s top threats has prompted veteran investor Clem Chambers to warn of an overlooked supply-chain squeeze that could jolt