Menu

Categories:

Hot right now:

Follow on:

Coinsurges provides coverage of fintech, blockchain, and Bitcoin, delivering the most recent news and analyses on the future of money. Stay up-to-date with live prices, charts, and trading options for the top exchanges. Keep track of the day's top cryptocurrency gainers and losers, as well as which coins have experienced gains and losses in the past 24 hours.
Trust Coinsurges as your go-to source for all news and updates in the industry.

Ethereum Bounces Back Strongly After $2,871 Support Rejection

Share This Post

On Wednesday, ETH, the native coin of the Ethereum blockchain experienced a significant rejection at the resistance level of $2,871. Since this rejection, the price of Ethereum has gained a significant upward movement of over 9% and showing signs of even moving further.

At the time of writing, the price is still showing strong signs of moving upward toward the 100-day Simple Moving Average (SMA) and the trendline, both in the 4-hour and the 1-day timeframe. The price of ETH is currently trading around $3,116 and about 0.47% up in the last 24 hours.

A Further Look At The Ethereum Chart With The Following Technical Indicators

100-Day Moving Average and Trendline: As seen in the image below, although the price of ETH is currently moving toward the 100-day simple moving average and the trendline, it is still trading below these two indicators. This means at a certain point, the price of Ethereum could make a possible reversal and continue in its movement toward the downside.

Ethereum

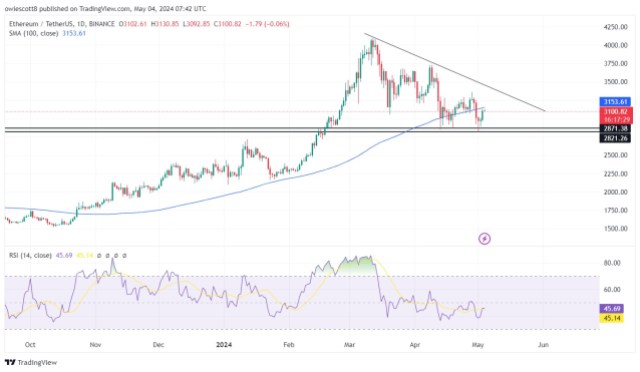
The RSI Indicator: Also observing the chart with the help of the Relative Strength Index Indication (RSI), it shows that the RSI signal line is trending above the 50 line which strongly indicates that the price might still move upward, as seen in the chart.

The 4-Hour MACD Indicator: After a close look at the MACD indicator in the 4-hour timeframe, it can be seen that the MACD histogram has moved above the zero line. Also, the MACD line and the signal line have crossed and are heading toward the zero line. This suggests there may be sustained upward price movement until a potential reversal.

Final Thought On ETH Movement

Based on Ethereum’s previous movement, there are two resistance levels of $3,250 and $3,355, and a support level of $2,819. As the price of Ethereum is moving upward, if it manages to break above the resistance level of $3,250, it might continue to move even further toward the $3,355 resistance level. 

On the contrary, if Ethereum fails to break its previous resistance level, it might reserve and start a move downward toward its previous support level of  $2,819. Should ETH succeed in breaching this level of support, it may descend even further to establish a new low.

Ethereum

Read Entire Article
spot_img
- Advertisement -spot_img

Related Posts

Bitcoin Mining Stocks Continue Rally as Applied Digital Leads Friday’s Gains

Bitcoin-mining stocks closed higher Friday, with Applied Digital Corporation jumping 2218% to top the leaderboard Bitcoin Miners Rally as Volatility Breeds Opportunity Applied Digital posted the

Ethereum Accumulation Accelerates – Smart Money Snaps Up 450K ETH

Ethereum is now at a pivotal moment following last week’s explosive rally that pushed prices above several key resistance levels After surging past $2,700, ETH has pulled back and is now

Cardano Market Structure Says Crash Is Coming, But $0.9 Is Still In The Cards

Cardano (ADA) is flashing mixed signals as its market structure hints at an imminent short-term price crash While bearish indicators suggest a possible decline, a crypto analyst reveals that the

GENIUS Act Vote on May 19: Will the U.S. Finally Regulate Stablecoins?

The post GENIUS Act Vote on May 19: Will the US Finally Regulate Stablecoins appeared first on Coinpedia Fintech News The US Senate is preparing to vote on the GENIUS Act (Guaranteed Electronic USD

Worried About How Tariffs Will Impact Your Portfolio? Best Time to Hold XRP, DOGE, and This Crypto with 15029% Upside

The post Worried About How Tariffs Will Impact Your Portfolio Best Time to Hold XRP, DOGE, and This Crypto with 15029% Upside appeared first on Coinpedia Fintech News Three tokens namely XRP, DOGE,

Litecoin Price Prediction: $300 by 2025? Ozak AI’s Rise Challenges Classic Altcoins

The post Litecoin Price Prediction: $300 by 2025 Ozak AI’s Rise Challenges Classic Altcoins appeared first on Coinpedia Fintech News Litecoin (LTC) has long held its place as a reliable, fast, and