Menu

Categories:

Hot right now:

Follow on:

Coinsurges provides coverage of fintech, blockchain, and Bitcoin, delivering the most recent news and analyses on the future of money. Stay up-to-date with live prices, charts, and trading options for the top exchanges. Keep track of the day's top cryptocurrency gainers and losers, as well as which coins have experienced gains and losses in the past 24 hours.
Trust Coinsurges as your go-to source for all news and updates in the industry.

Arbitrum Prints TD Buy Signal: Trend About To Flip?

Share This Post

An analyst has pointed out how Arbitrum (ARB) has formed a Tom Demark (TD) Sequential buy signal on its weekly chart recently.

Arbitrum May Have Hit A Point Of Reversal According To TD Sequential

In a new post on X, analyst Ali has discussed a TD Sequential signal that Arbitrum has observed in its weekly price recently. The “TD Sequential” is an indicator in technical analysis generally used for locating probable reversal points in any asset’s price.

This indicator has two phases, the first of which is known as the “setup.” In this phase, candles of the same polarity are counted up to nine, and once these nine candles are in, the price may be assumed to have reached a possible turnaround.

Naturally, if these candles were green, the TD Sequential would suggest a potential sell signal for the asset, while if they were red, the indicator would shoot a buy signal.

Once the setup is complete, the “countdown” phase begins. The countdown works much like the setup, except that it lasts thirteen candles, not nine. The countdown’s finish leads to another likely top or bottom for the price.

Now, here is the chart shared by Ali that shows the TD Sequential signal that Arbitrum has just formed in its weekly price:

Arbitrum Price Chart

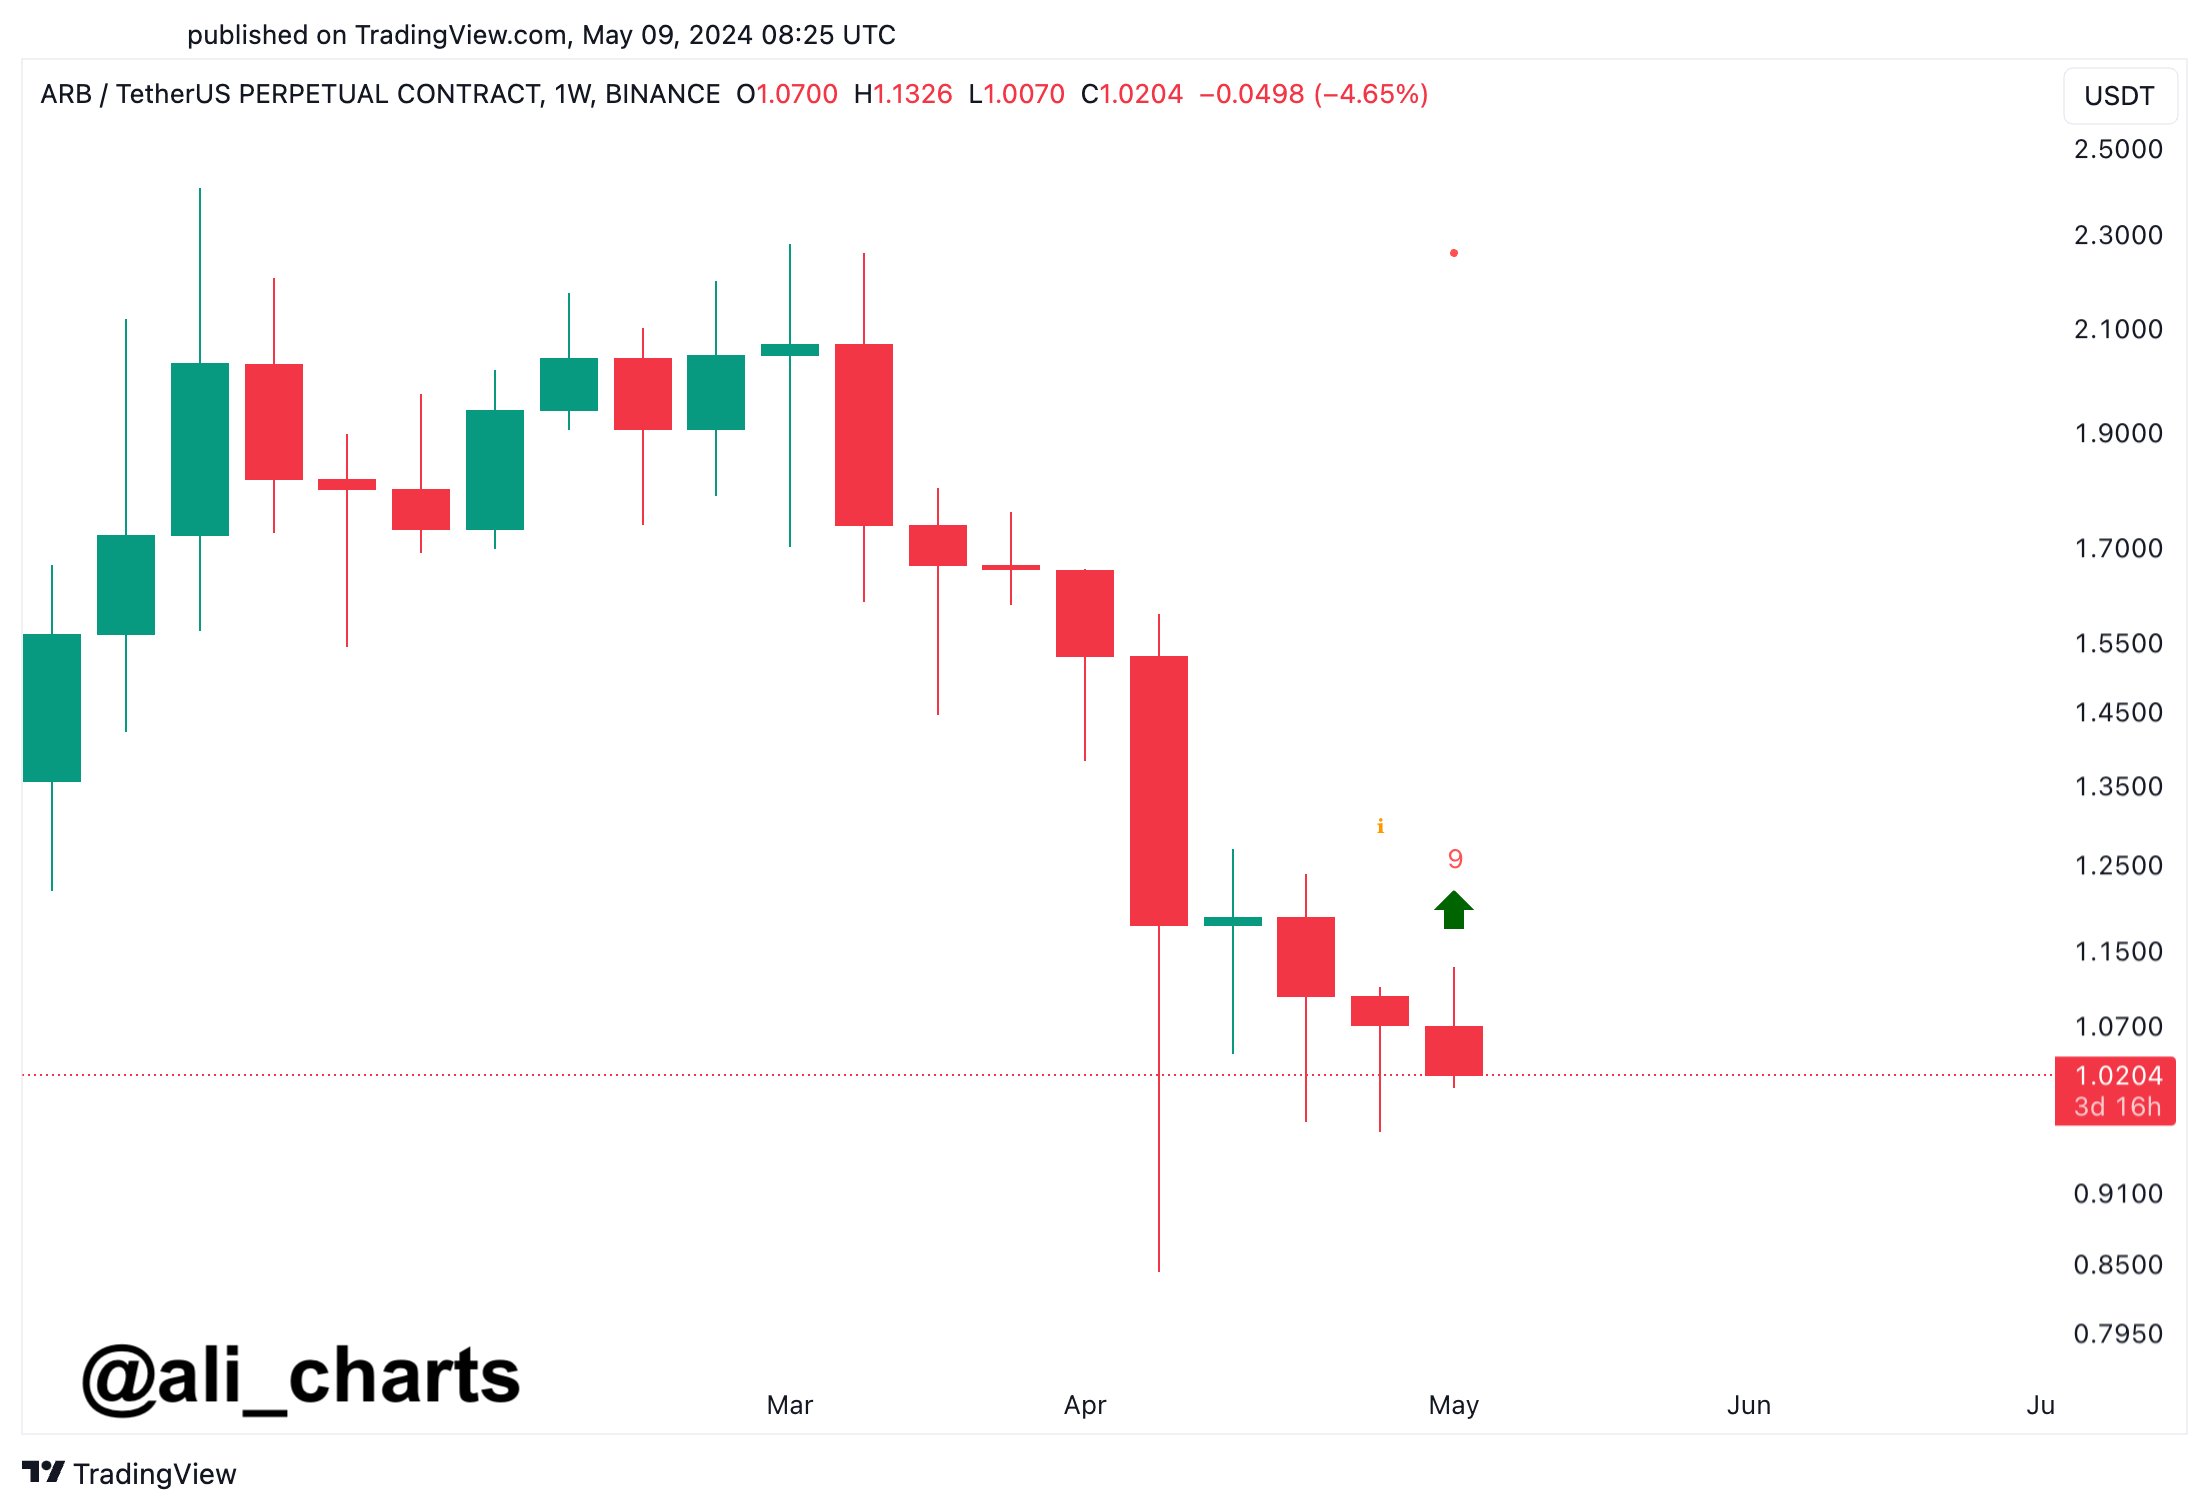
As displayed in the above graph, Arbitrum has recently completed a TD Sequential setup on its weekly price with red candles. This naturally means that, according to the indicator, the asset should likely reverse towards the upside now.

The analyst suggests that this buy signal “anticipates a one to four candlesticks rebound for ARB.” Given this pattern, how the coin’s price will develop in the coming days remains to be seen.

In some other news, the Arbitrum network has recently observed its transaction activity go up, as market intelligence platform IntoTheBlock has pointed out in an X post.

Arbitrum Transactions

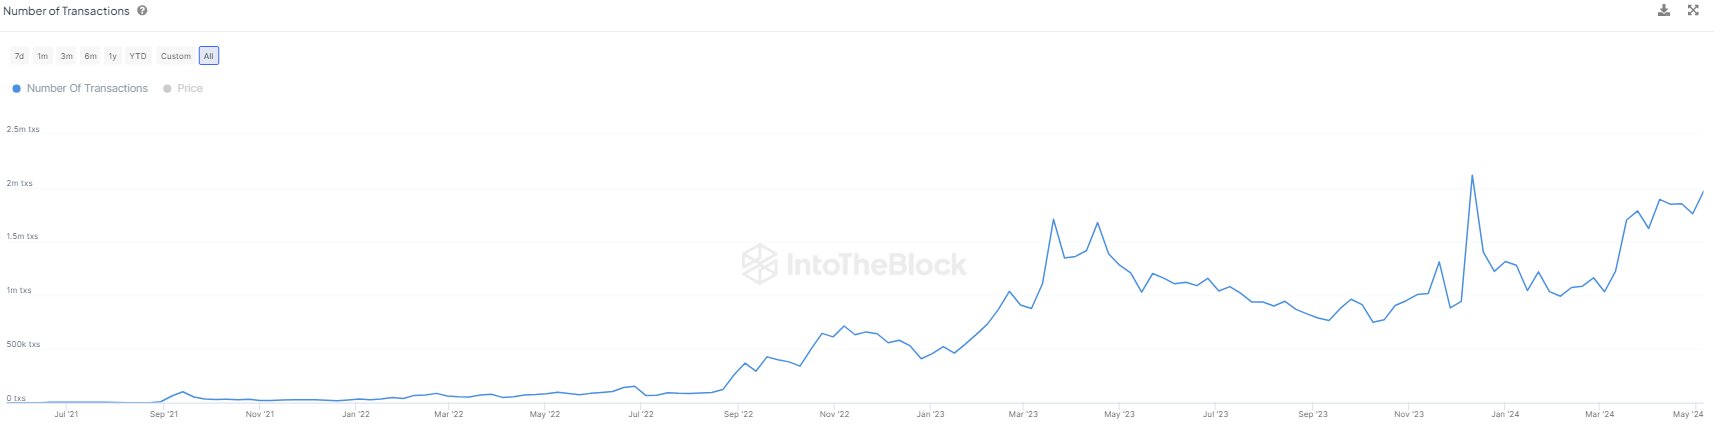
The chart shows that the number of transactions on Arbitrum has been increasing in the last couple of months. Back in early March, the network’s average transfer count stood at around 1 million, but recently, it has crossed the 2 million mark.

A high transaction count is generally a sign that traders are interested in the asset. This could lead to more volatility for the coin’s price, although its direction can go either way.

ARB Price

At the time of writing, Arbitrum is trading around $1.01, down almost 2% over the past seven days.

Arbitrum Price Chart

Read Entire Article
spot_img
- Advertisement -spot_img

Related Posts

Gas On Empty: Ethereum Fees Fall To 2019 Levels—Details

Ethereum transaction costs have fallen to their lowest point in five years The drop comes as users pull back from the network amid economic concerns, according to data from Santiment, an on-chain

Ethereum Eyes Another Correction as Selloff Risks Grow: What’s Next for ETH Price?

The post Ethereum Eyes Another Correction as Selloff Risks Grow: What’s Next for ETH Price appeared first on Coinpedia Fintech News Following comments by Federal Reserve Chair Jerome Powell,

StanChart sees stablecion supply rising to $2T by 2028 following US legislation

Standard Chartered believes stablecoin supply could swell to $2 trillion by 2028, driving $16 trillion in new demand for US Treasury bills if upcoming US legislation passes as expected The report,

Fed Rate Cut Odds Dwindle Despite Trump’s Criticism

Just five days ago, the likelihood of a quarter-point rate cut was higher, but with fewer than 20 days remaining until the US central bank’s next Federal Open Market Committee (FOMC) meeting, those

Ethereum Whales Offload 143,000 ETH In One Week – More Selling Ahead?

Ethereum is trading around the $1,600 level after several days of failed attempts to reclaim higher prices Bulls are showing signs of life, but their momentum remains weak as bearish pressure

Bitcoin Coinbase Premium Index Edges Toward Positive Territory, Investor Optimism Recovering?

After persistent bearish pressure on Wednesday, Bitcoin’s price witnessed a brief upward move to the $85,000 threshold as buying interest slowly increased Despite waning price movements, key