Ethereum price is attempting a recovery wave from the $2,865 support. ETH might start a fresh surge if it clears the $2,960 resistance zone.
- Ethereum remained stable and attempted a recovery wave above $2,900.
- The price is trading below $2,950 and the 100-hourly Simple Moving Average.
- There was a break above a major bearish trend line with resistance at $2,930 on the hourly chart of ETH/USD (data feed via Kraken).
- The pair could start a major increase if there is a close above the $2,990 and $3,000 resistance levels.
Ethereum Price Holds Support
Ethereum price traded as low as $2,864 and recently started an upside correction, like Bitcoin. ETH was able to rise above the $2,900 and $2,920 resistance levels. Besides, there was a break above a major bearish trend line with resistance at $2,930 on the hourly chart of ETH/USD.
The price even spiked above $2,980 and tested $3,000. A high was formed at $2,992 and the price is now correcting gains. There was a minor move below the $2,960 level. The price dipped below the 23.6% Fib retracement level of the recent increase from the $2,864 swing low to the $2,992 high.
Ethereum is now trading below $2,950 and the 100-hourly Simple Moving Average. Immediate resistance is near the $2,950 level and another connecting bearish trend line on the same chart. If the bulls push the price and repeat the recent breakout, the price might start another increase.
The first major resistance is near the $3,000 level. The next key resistance sits at $3,050, above which the price might gain traction and rise toward the $3,120 level.
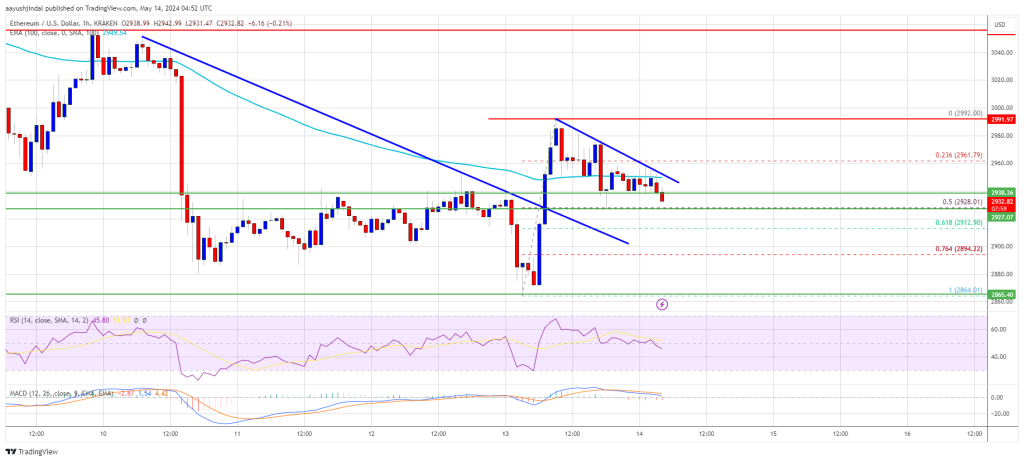
Source: ETHUSD on TradingView.com
If there is a clear move above the $3,150 level, the price might rise and test the $3,220 resistance. Any more gains could send Ether toward the $3,250 resistance zone.
Another Failure In ETH?
If Ethereum fails to clear the $2,950 resistance, it could start another decline. Initial support on the downside is near the $2,2930 level and the 50% Fib retracement level of the recent increase from the $2,864 swing low to the $2,992 high.
The first major support is near the $2,900 zone. The next support is near the $2,865 level. A clear move below the $2,865 support might push the price toward $2,740. Any more losses might send the price toward the $2,650 level in the near term.
Technical Indicators
Hourly MACD – The MACD for ETH/USD is gaining momentum in the bearish zone.
Hourly RSI – The RSI for ETH/USD is now below the 50 level.
Major Support Level – $2,865
Major Resistance Level – $2,950


