An analyst has pointed out that Injective is forming a buy signal that previously led to 700% and 555% rallies for the asset’s price.
Injective Is Forming A TD Sequential Buy Signal On Its Weekly Chart
In a new post on X, analyst Ali Martinez has discussed a Tom Demark (TD) Sequential signal that has formed in the weekly price of Injective recently. The TD Sequential refers to an indicator in technical analysis (TA) generally used for spotting potential points of reversal in any asset’s price.
This indicator involves two phases: setup and countdown. In the first of this setup, candles of the same polarity (green/red) are counted up to nine. Once the nine candles are in, the price may have reached a turnaround point.
Naturally, the TD Sequential would suggest a probable bottom in the asset if the candles leading up to the setup’s completion were red. Similarly, the indicator would signal selling if the phase finished with an uptrend.
After the setup is done, the countdown phase begins. During this second phase, candles of the same type are again counted, this time till thirteen. After the thirteenth candle of the same polarity, the price may be assumed to have encountered another likely top or bottom.
According to Martinez, a TD Sequential signal of the former type has been completed for the Injective’s weekly price. Below is the chart shared by the analyst that reveals this recent signal in cryptocurrency.
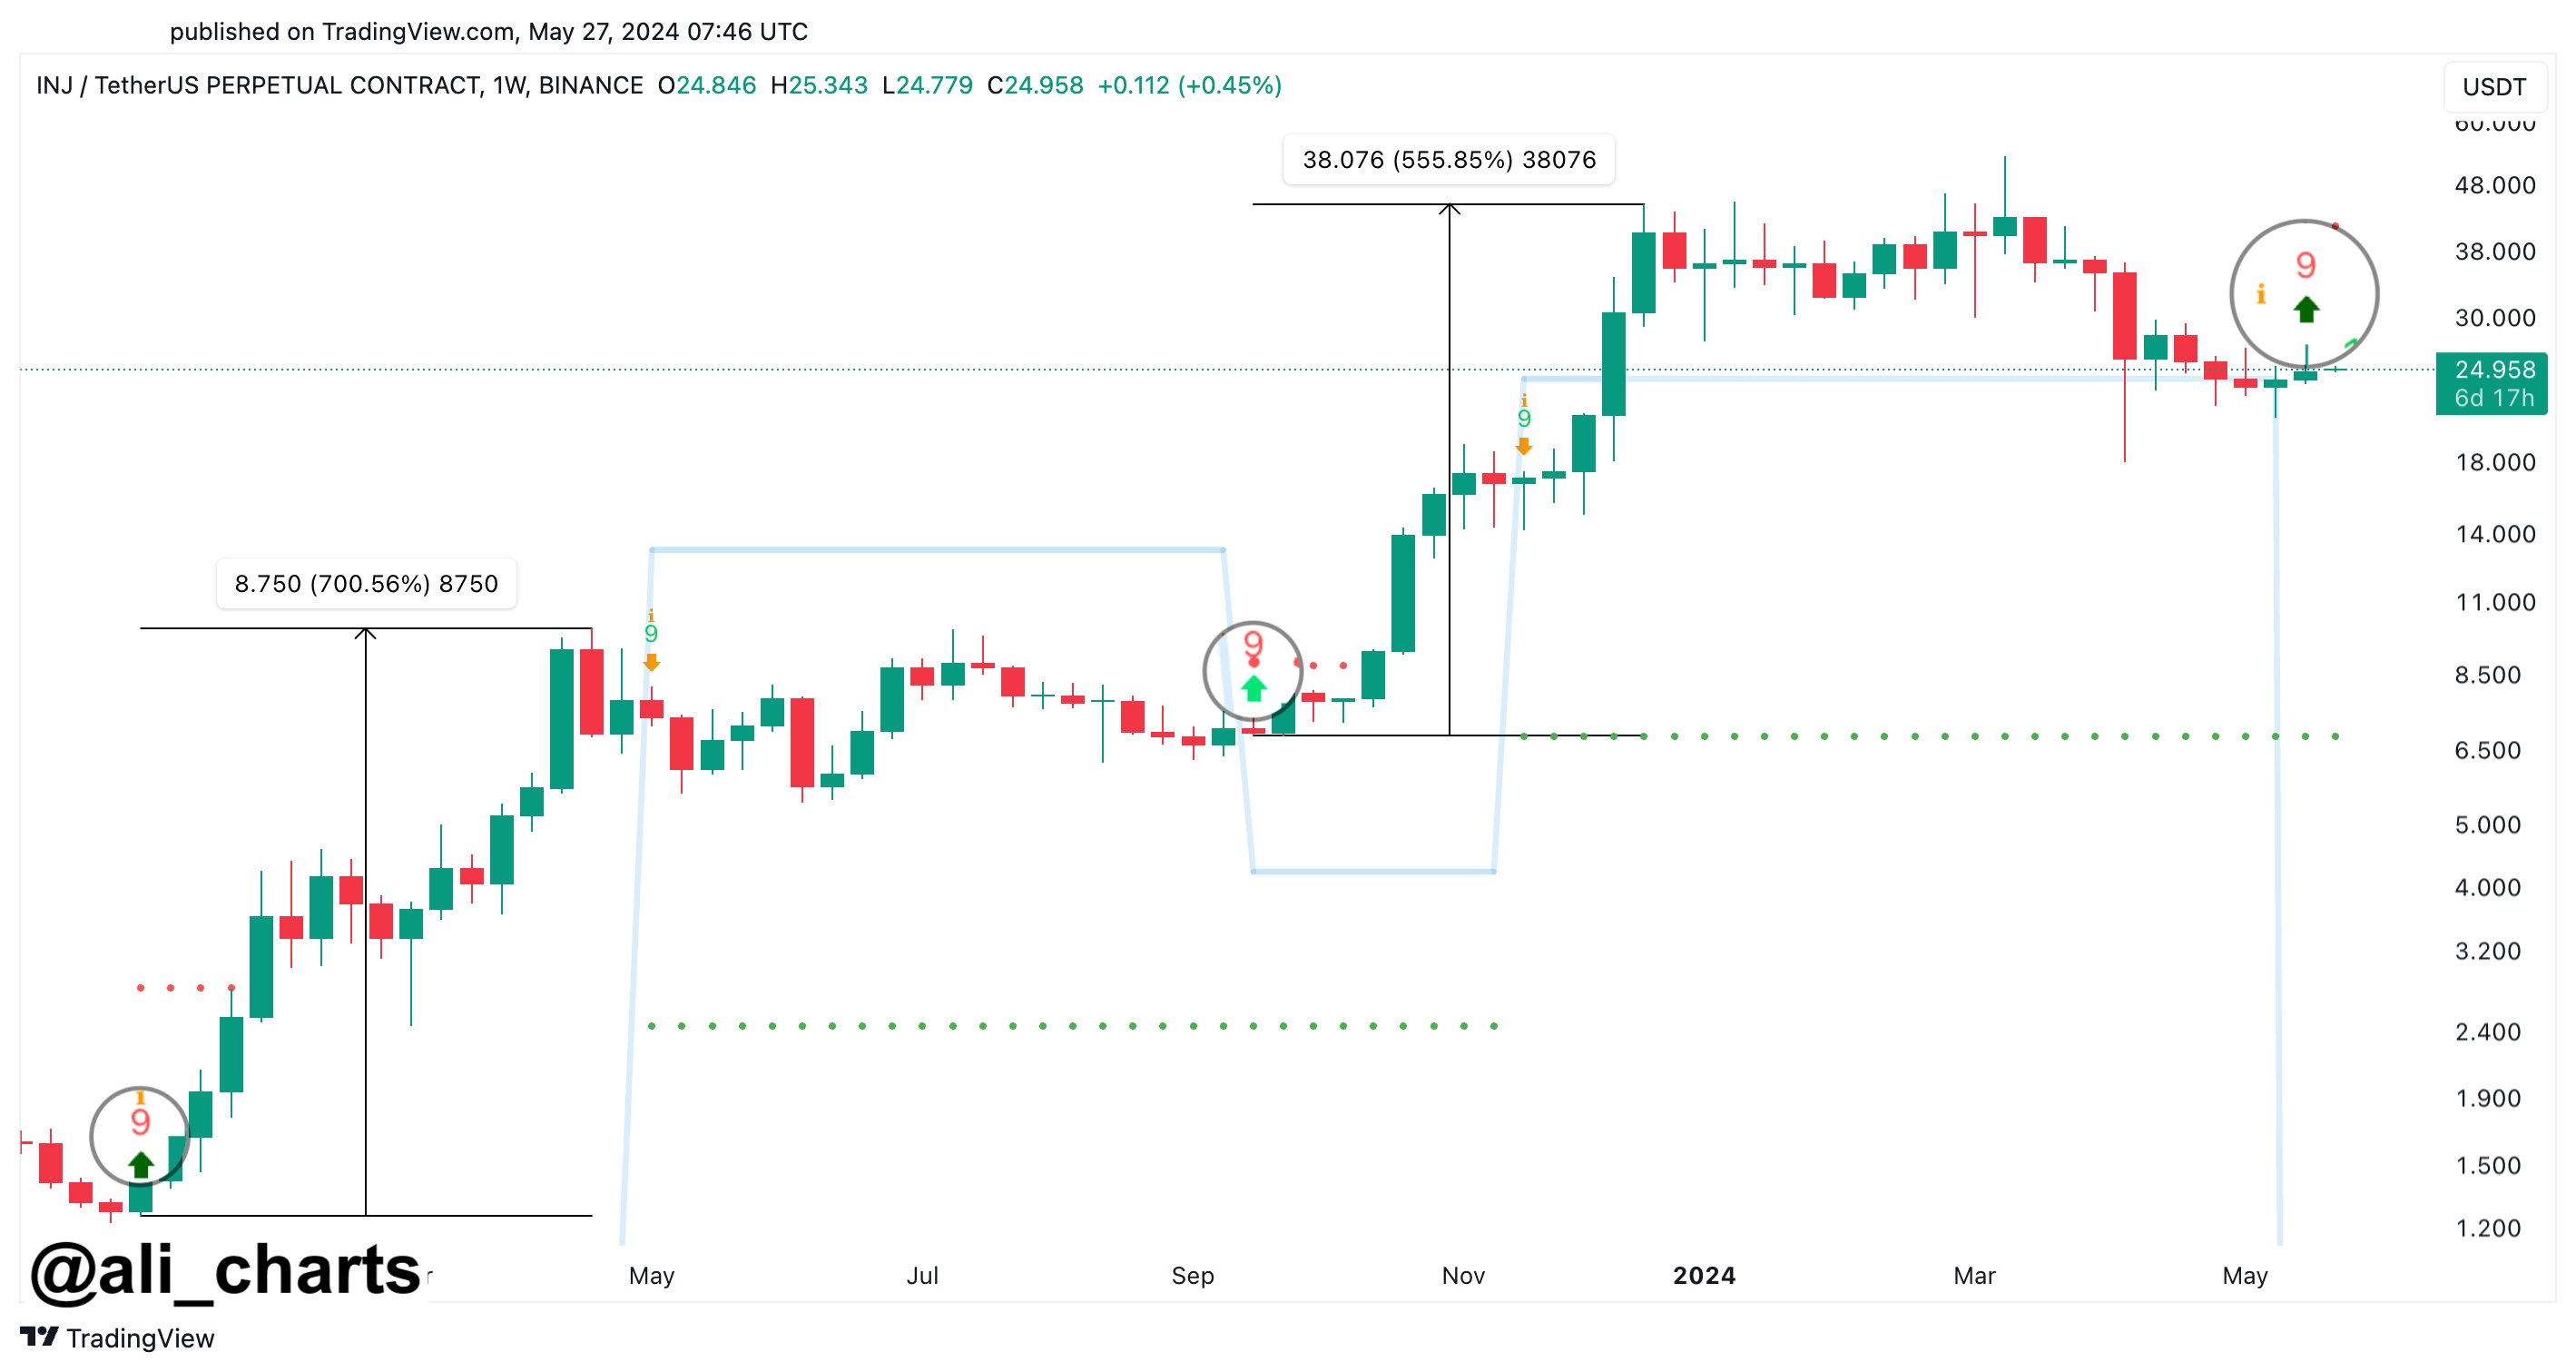
As the graph shows, Injective has finished a TD Sequential setup with a downtrend, suggesting that the asset may have reached a point of reversal towards the upside.
In the chart, the analyst has highlighted what happened the last two times the weekly price of the cryptocurrency encountered this signal. The first of these signals appeared to have preceded a rally of over 700%, while the other resulted in a surge of almost 556%.
Thus, given this bullish precedence, it’s possible that the latest TD Sequential buy signal could also lead to another run of sharp bullish momentum for the asset’s price.
However, it should be noted that the TD Sequential hasn’t always been completely reliable for the coin. As is visible in the graph, the indicator flagged a sell signal partway through the second of the rallies above.
As such, it remains to be seen how the Injective price develops from here on out and whether the TD Sequential buy signal will have an immediate bullish effect, just like it did the last two times.
INJ Price
The Injective has been stuck in consolidation over the past month. Its price is currently trading around $26, right in the middle of the range.


