XRP price again struggled to continue higher above the $0.540 resistance. It is now consolidating near $0.5320 and might aim for an upside break.
- XRP is still facing many hurdles near the $0.5420 zone.
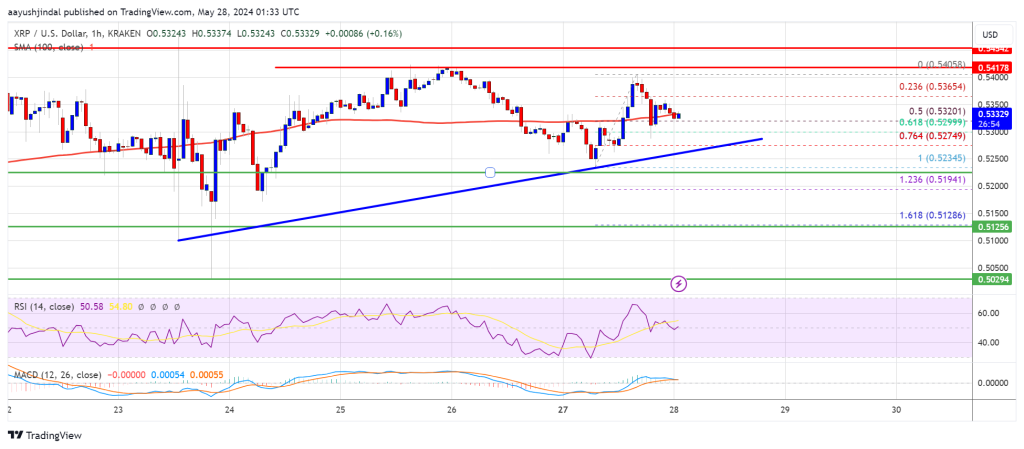
- The price is now trading near $0.5320 and the 100-hourly Simple Moving Average.
- There is a connecting bullish trend line forming with support near $0.5265 on the hourly chart of the XRP/USD pair (data source from Kraken).
- The pair could start a fresh increase if the bulls remain active above the $0.5220 zone.
XRP Price Holds Support
In the past few sessions, XRP price traded in a positive zone like Bitcoin and Ethereum. However, the bears were active near the $0.540 and $0.5420 resistance levels.
The recent high was formed at $0.5405 and the price is now correcting gains in a range. There was a move below the $0.5340 support zone and the price spiked below the 50% Fib retracement level of the upward move from the $0.5234 swing low to the $0.5405 high.
However, the bulls are active near the $0.530 zone and the 61.8% Fib retracement level of the upward move from the $0.5234 swing low to the $0.5405 high. There is also a connecting bullish trend line forming with support near $0.5265 on the hourly chart of the XRP/USD pair.
The pair is now trading near $0.5320 and the 100-hourly Simple Moving Average. Immediate resistance is near the $0.5365 level. The first key resistance is near $0.5420. A close above the $0.5420 resistance zone could send the price higher. The next key resistance is near $0.5450.
If there is a close above the $0.5450 resistance level, there could be a steady increase toward the $0.5550 resistance. Any more gains might send the price toward the $0.5720 resistance.
More Downsides?
If XRP fails to clear the $0.5420 resistance zone, it could continue to move down. Initial support on the downside is near the $0.5265 level and the trend line.
The next major support is at $0.520. If there is a downside break and a close below the $0.520 level, the price might gain bearish momentum. In the stated case, the price could decline and retest the $0.5120 support in the near term.
Technical Indicators
Hourly MACD – The MACD for XRP/USD is now losing pace in the bullish zone.
Hourly RSI (Relative Strength Index) – The RSI for XRP/USD is now above the 50 level.
Major Support Levels – $0.5300 and $0.5200.
Major Resistance Levels – $0.5365 and $0.5420.


