In a technical analysis, renowned crypto analyst Gert van Lagen presented an extremely bearish outlook for Solana (SOL), suggesting that its price is poised for a substantial downside move. Van Lagen’s analysis is underpinned by the widely acclaimed Elliott Wave Theory, a methodology that seeks to identify recurring patterns and cycles in market price movements.
Why The Solana Price Could Crash
At the core of Van Lagen’s analysis lies a dissection of Solana’s price action over the past few years. According to his assessment, the year 2021 marked the culmination of a clean Elliott Wave trend for Solana, signaling the end of a bullish cycle. This uptrend is characterized by a specific pattern of five waves, with the final wave acting as the climactic move before a reversal.
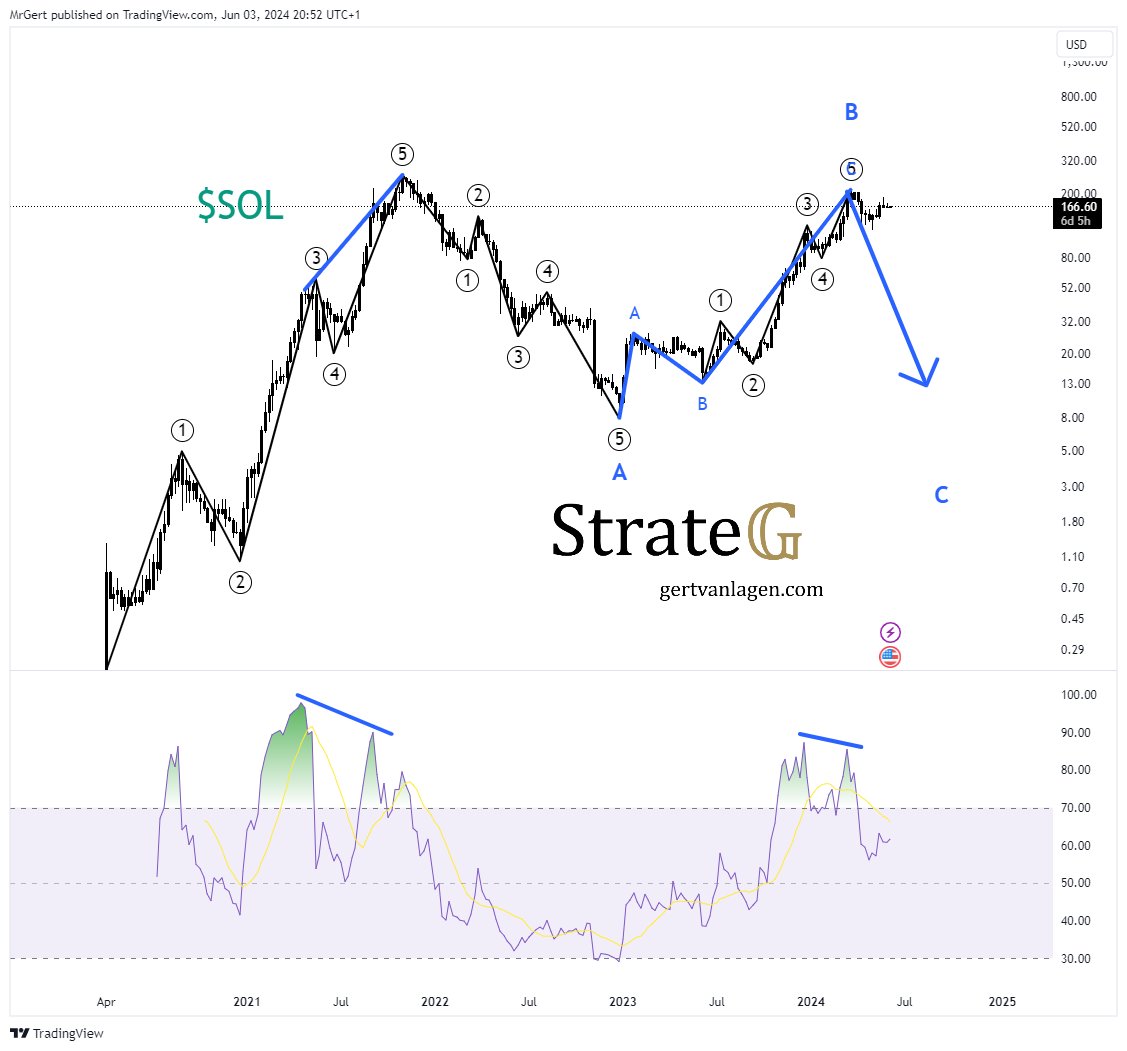
Moving into 2022, Van Lagen’s analysis identifies the unfolding of the A-wave down, which he classifies as the first leg of a prolonged bear market. Crucially, this A-wave down exhibits a distinct pattern of five subwaves, aligning with the principles of the Elliott Wave Theory. The presence of these subwaves is a key indicator that the downtrend is likely to persist, as they are believed to reflect the underlying market sentiment and psychology.
In 2023, Van Lagen observed the formation of the B-wave, a corrective rally within the broader bear market context. Just like the A-wave, this B-wave is composed of five subwaves, adhering to the Elliott Wave Pattern for corrective movements. The identification of this B-wave is crucial, as it suggests that the overall downtrend has not yet been fully exhausted and that further downside momentum may be forthcoming.
As the analysis shifts to 2024, Van Lagen’s expectation is for the C-wave to materialize. In the Elliott Wave Framework, the C-wave is the final leg of the broader bear market cycle, and its occurrence would potentially mark the completion of the ongoing downtrend for Solana.
Notably, Van Lagen’s analysis also highlights the presence of bearish divergence on the weekly Relative Strength Index (RSI), a widely used momentum oscillator. Bearish divergence occurs when the price makes higher highs while the RSI fails to confirm these highs, potentially signaling a forthcoming trend reversal or a loss of bullish momentum.
Van Lagen posted via X: “I’m short on SOL –> ready for the next leg down. 2021: Finalized a clean Elliottwave up; 2022: A-wave down of prolonged bear market <- 5 subwaves; 2023: B-wave of prolonged bear market <- 3 subwaves; 2024: Expectation is C-wave down. Bearish divergence on the weekly RSI.”
Notably, the analyst refrains from specifying an exact price target. However, the blue arrow on the chart suggests that van Lagen anticipates the SOL price could plummet to approximately $13. Such a decline would represent a dramatic price crash of more than 90% from the current price level.
A 50% Chance That This Will Happen
In his commentary, Van Lagen acknowledged the risks associated with his short position on Solana, characterizing it as a “50/50 trade” and “ballsy.” However, he defended his decision by stating that it is backed by a “good theoretical framework” and serves as a hedge against his long positions in other assets. The analyst emphasized the importance of analyzing the isolated chart without emotion, underscoring the need for objectivity in technical analysis.
“Short on SOL is a 50/50 trade, ballsy, but also a hedge against my long positions. There’s good reason to do so when looking at the isolated chart without emotion. It’s a risky trade and I’m aware of it. But also backed by a good theoretical framework,” he stated.
While Van Lagen’s analysis presents a bearish outlook for Solana based on the Elliott Wave Theory, it is crucial to recognize that the broader crypto market often moves in tandem with Bitcoin. This correlation raises questions among other market participants. One user encapsulated this sentiment by commenting, “This is really strange. You think BTC will move up in the coming weeks but SOL will move down? We are still in a market structure where big coins don’t move down that much while Bitcoin is moving up.”
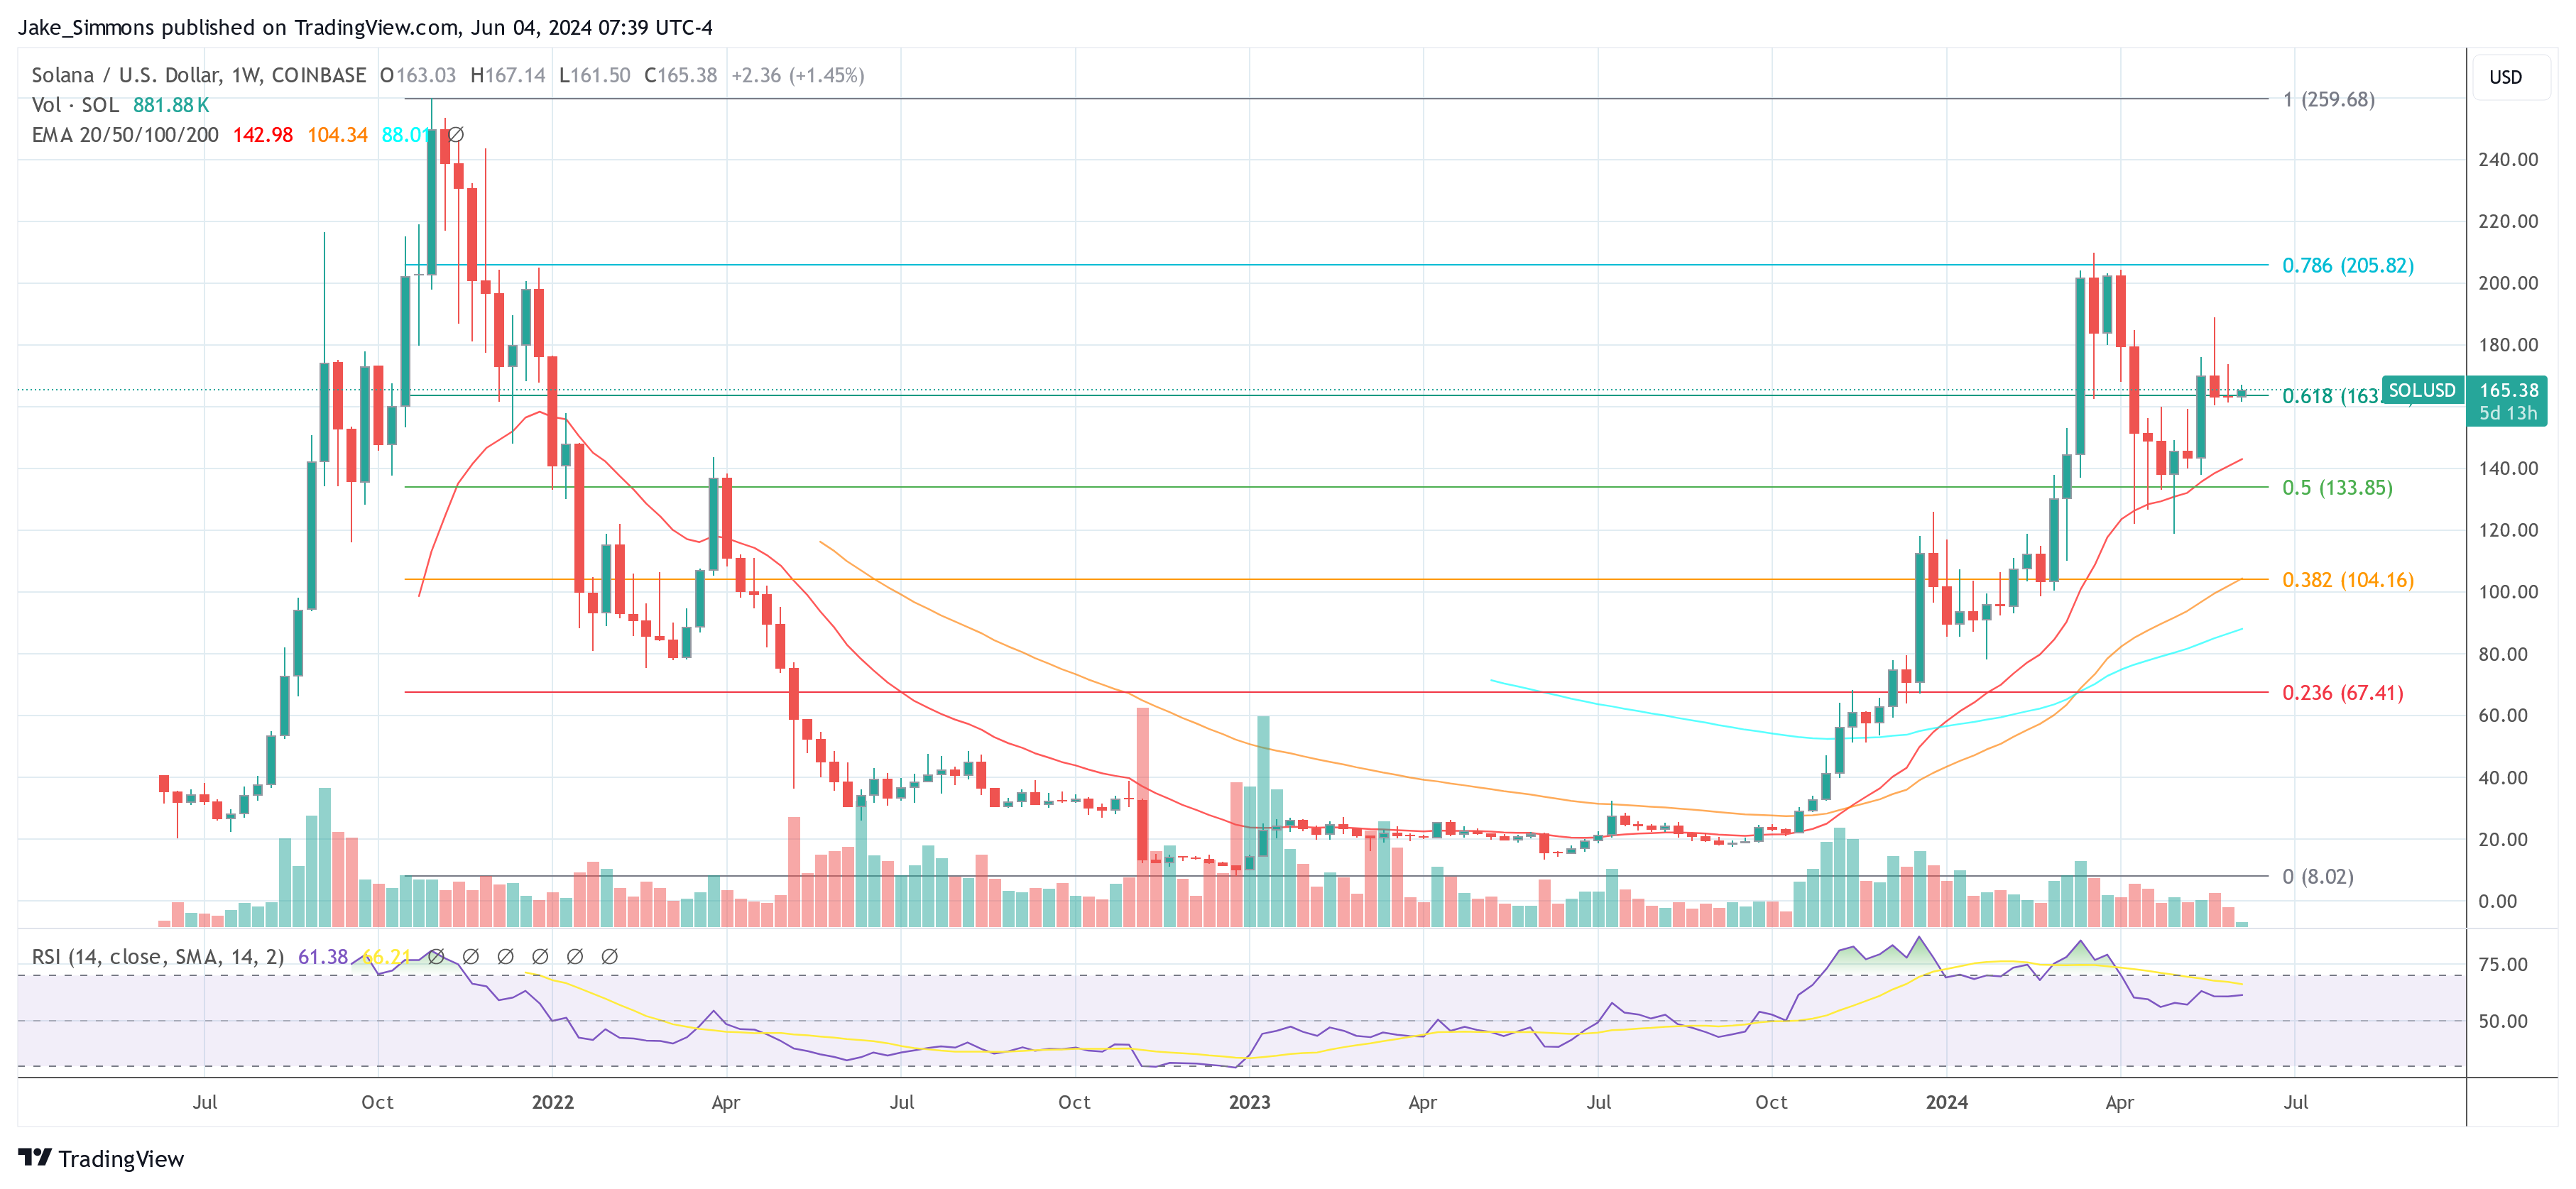
At press time, SOL traded at $165.