Bitcoin has recently been spotlighted due to an intriguing buy signal identified on its hourly chart. This indication emerges amidst a notable fluctuation in Bitcoin’s price, setting the stage for potential short-term gains.
Renowned crypto analyst Ali has highlighted a significant development on the hourly chart of Bitcoin, specifically noting a ‘buy signal’ detected by the TD Sequential indicator. This technical tool, developed by Tom DeMark, is respected for its ability to predict price reversals by analyzing exhaustion points in trends.
Decoding The TD Sequential Indicator On Bitcoin Chart
The TD Sequential operates in two main phases: the setup and the countdown. The setup phase requires nine consecutive price bars closing progressively higher or lower, depending on the trend’s direction.
Following a successful setup, the countdown phase begins, searching for a sequence of 13 bars that continue the trend but must close beyond the high or low of two bars prior.
Completing this countdown typically signals an exhausted trend, poised for a reversal. Bitcoin’s hourly chart shows the completion of this pattern, suggesting an imminent uptick over the next few hours.
The TD Sequential presents a buy signal on the #Bitcoin hourly chart, predicting a potential rebound of one to four candlesticks for $BTC! pic.twitter.com/pnAMFHHbPe
— Ali (@ali_charts) June 11, 2024
This technical prognosis arrives as Bitcoin contends with downward pressure, recently dipping below $67,000, a price level not seen since late May. Currently, Bitcoin is trading at $66,855, marking a 3.7% decline, which has sparked widespread commentary among investors and analysts.
Buy The Dip, Says Mow
Samson Mow, the CEO of Jan3 and a notable Bitcoin advocate, recently stirred the Bitcoin community with a post on his X account that included an optimistic forecast for Bitcoin’s price. Revisiting his earlier post, he added a highly optimistic prediction that Bitcoin could reach as high as $1 million per BTC.
In his post, Mow used a visual diagram to compare the current available capital in the market with the amount of Bitcoin available and potentially mine-able in the future.
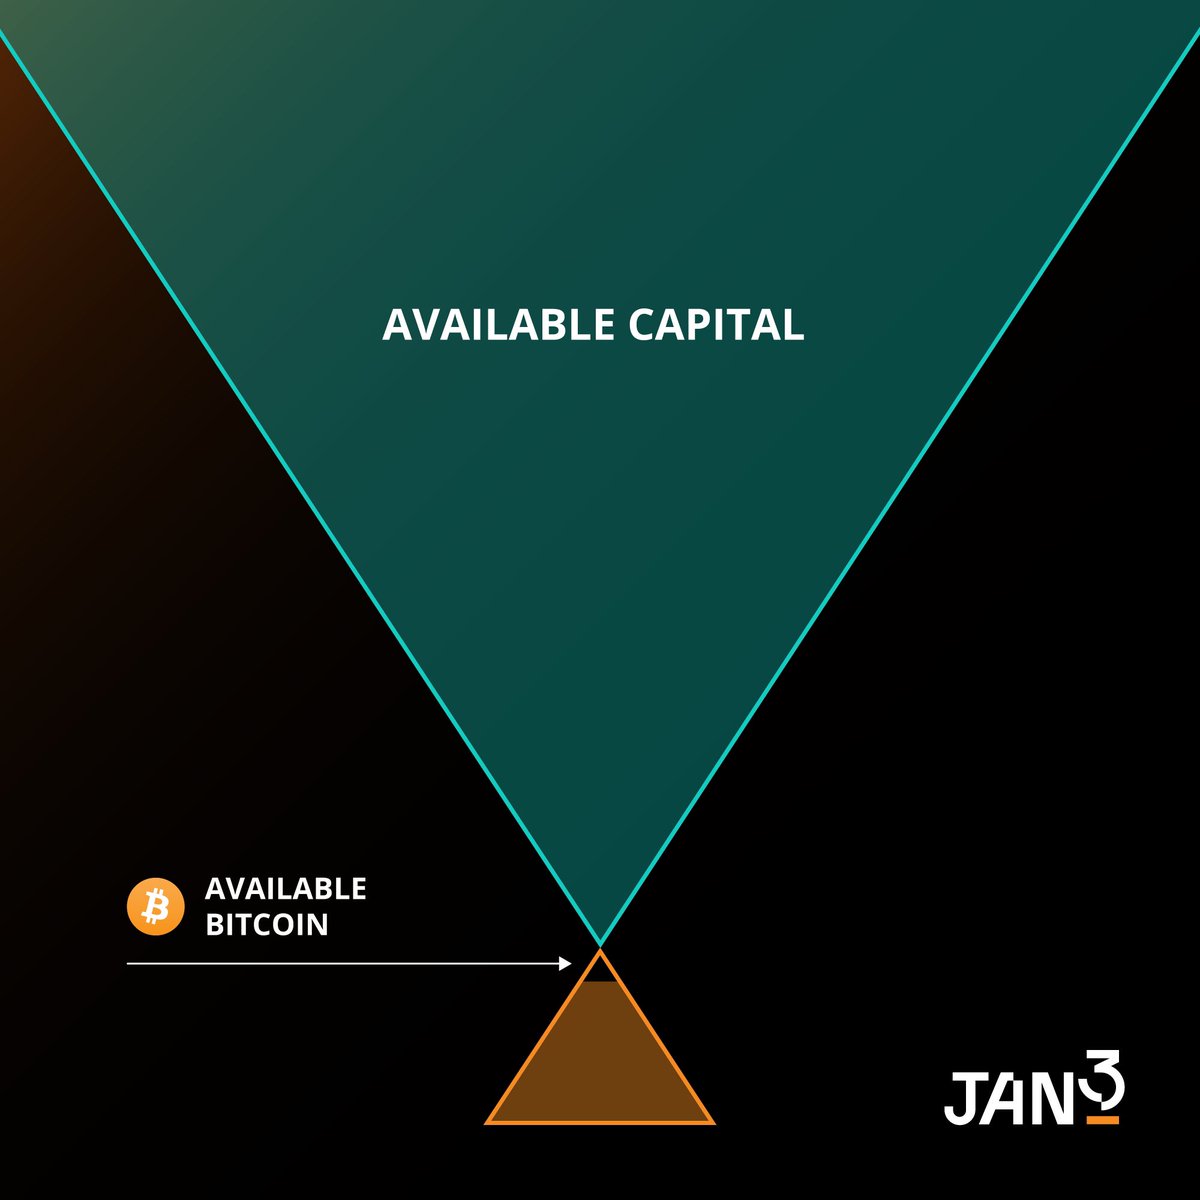
The illustration did not specify quantities but effectively showed the small amount of Bitcoin available relative to the vast amount of capital that could potentially purchase it.
The diagram, designed as overlapping triangles resembling an hourglass, emphasized the scarcity of Bitcoin in comparison to available capital.
Mow’s post highlighted his perspective on the ongoing price dip, suggesting that despite the drop, the fundamental outlook for Bitcoin remains strong due to its limited supply and growing adoption. He use the term “BTFD” – “buy the f**king dip” – to suggest a bullish outlook.
Feels weird seeing #Bitcoin price go down when we’re at a level of unprecedented adoption. BTFD!
— Samson Mow (@Excellion) June 11, 2024
Featured image created with DALL-E, Chart from TradingView


