XRP price failed to recover above the $0.50 resistance zone. The price is again moving lower and there is risk of more downsides below $0.4840.
- XRP is still showing bearish signs and struggled near $0.50.
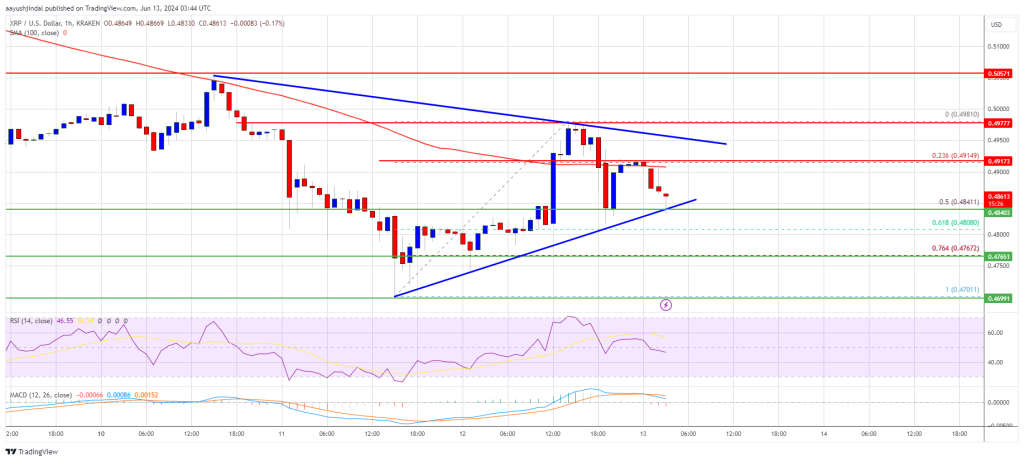
- The price is now trading below $0.4920 and the 100-hourly Simple Moving Average.
- There is a key contracting triangle forming with resistance at $0.4950 on the hourly chart of the XRP/USD pair (data source from Kraken).
- The pair could recover, but the bears might be active near the $0.4950 resistance.
XRP Price Dips
XRP price failed to recover above the $0.50 resistance like Ethereum and Bitcoin. The price peaked near the $0.4981 level and recently started another decline.
There was a move below the $0.4980 and $0.4950 levels. The price declined below the 23.6% Fib retracement level of the upward move from the $0.4701 swing low to the $0.4981 high. It is now trading below $0.4920 and the 100-hourly Simple Moving Average.
The bulls are now active near the $0.4840 support and the 50% Fib retracement level of the upward move from the $0.4701 swing low to the $0.4981 high.
On the upside, the price is facing resistance near the $0.4920 level. The first key resistance is near $0.4950. There is also a key contracting triangle forming with resistance at $0.4950 on the hourly chart of the XRP/USD pair. The next major resistance is near the $0.50 level.
A close above the $0.50 resistance zone could send the price higher. The next key resistance is near $0.5050. If there is a close above the $0.5050 resistance level, there could be a steady increase toward the $0.5250 resistance. Any more gains might send the price toward the $0.5320 resistance.
More Losses?
If XRP fails to clear the $0.4950 resistance zone, it could continue to move down. Initial support on the downside is near the $0.4840 level.
The next major support is at $0.4765. If there is a downside break and a close below the $0.4765 level, the price might accelerate lower. In the stated case, the price could decline and retest the $0.4550 support in the near term.
Technical Indicators
Hourly MACD – The MACD for XRP/USD is now gaining pace in the bearish zone.
Hourly RSI (Relative Strength Index) – The RSI for XRP/USD is now below the 50 level.
Major Support Levels – $0.4840 and $0.4765.
Major Resistance Levels – $0.4950 and $0.5000.


