This week has been an eventful one for Ethereum, with the launch of spot ETH ETFs imminent by the end of summer.
The SEC has closed its long-running investigation into Ethereum 2.0, determining that the sales of ETH did not constitute securities transactions. The June 19 decision is a culmination of a streak of good news for Ethereum, which began a slow and steady consolidation last week.
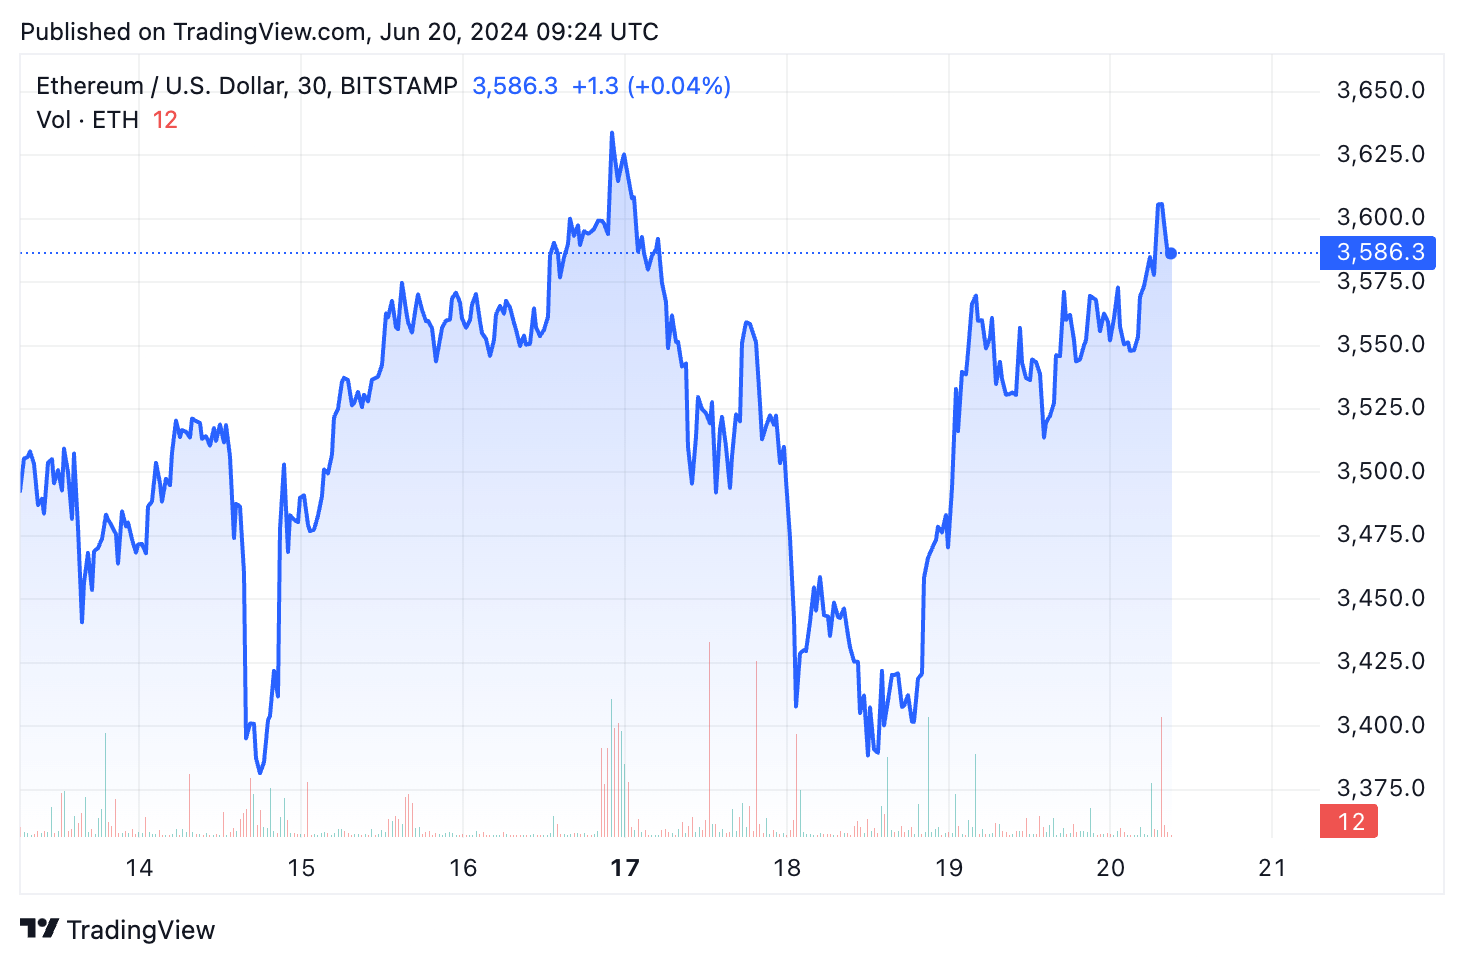
Ethereum experienced a slight upward trend starting on June 13, peaking on June 16 at $3,619 before dipping back down. However, as the price fluctuation last week was relatively modest, it suggests a period of consolidation rather than extreme volatility. Stability like this can often indicate a market waiting for a significant event or news to trigger a more decisive movement.

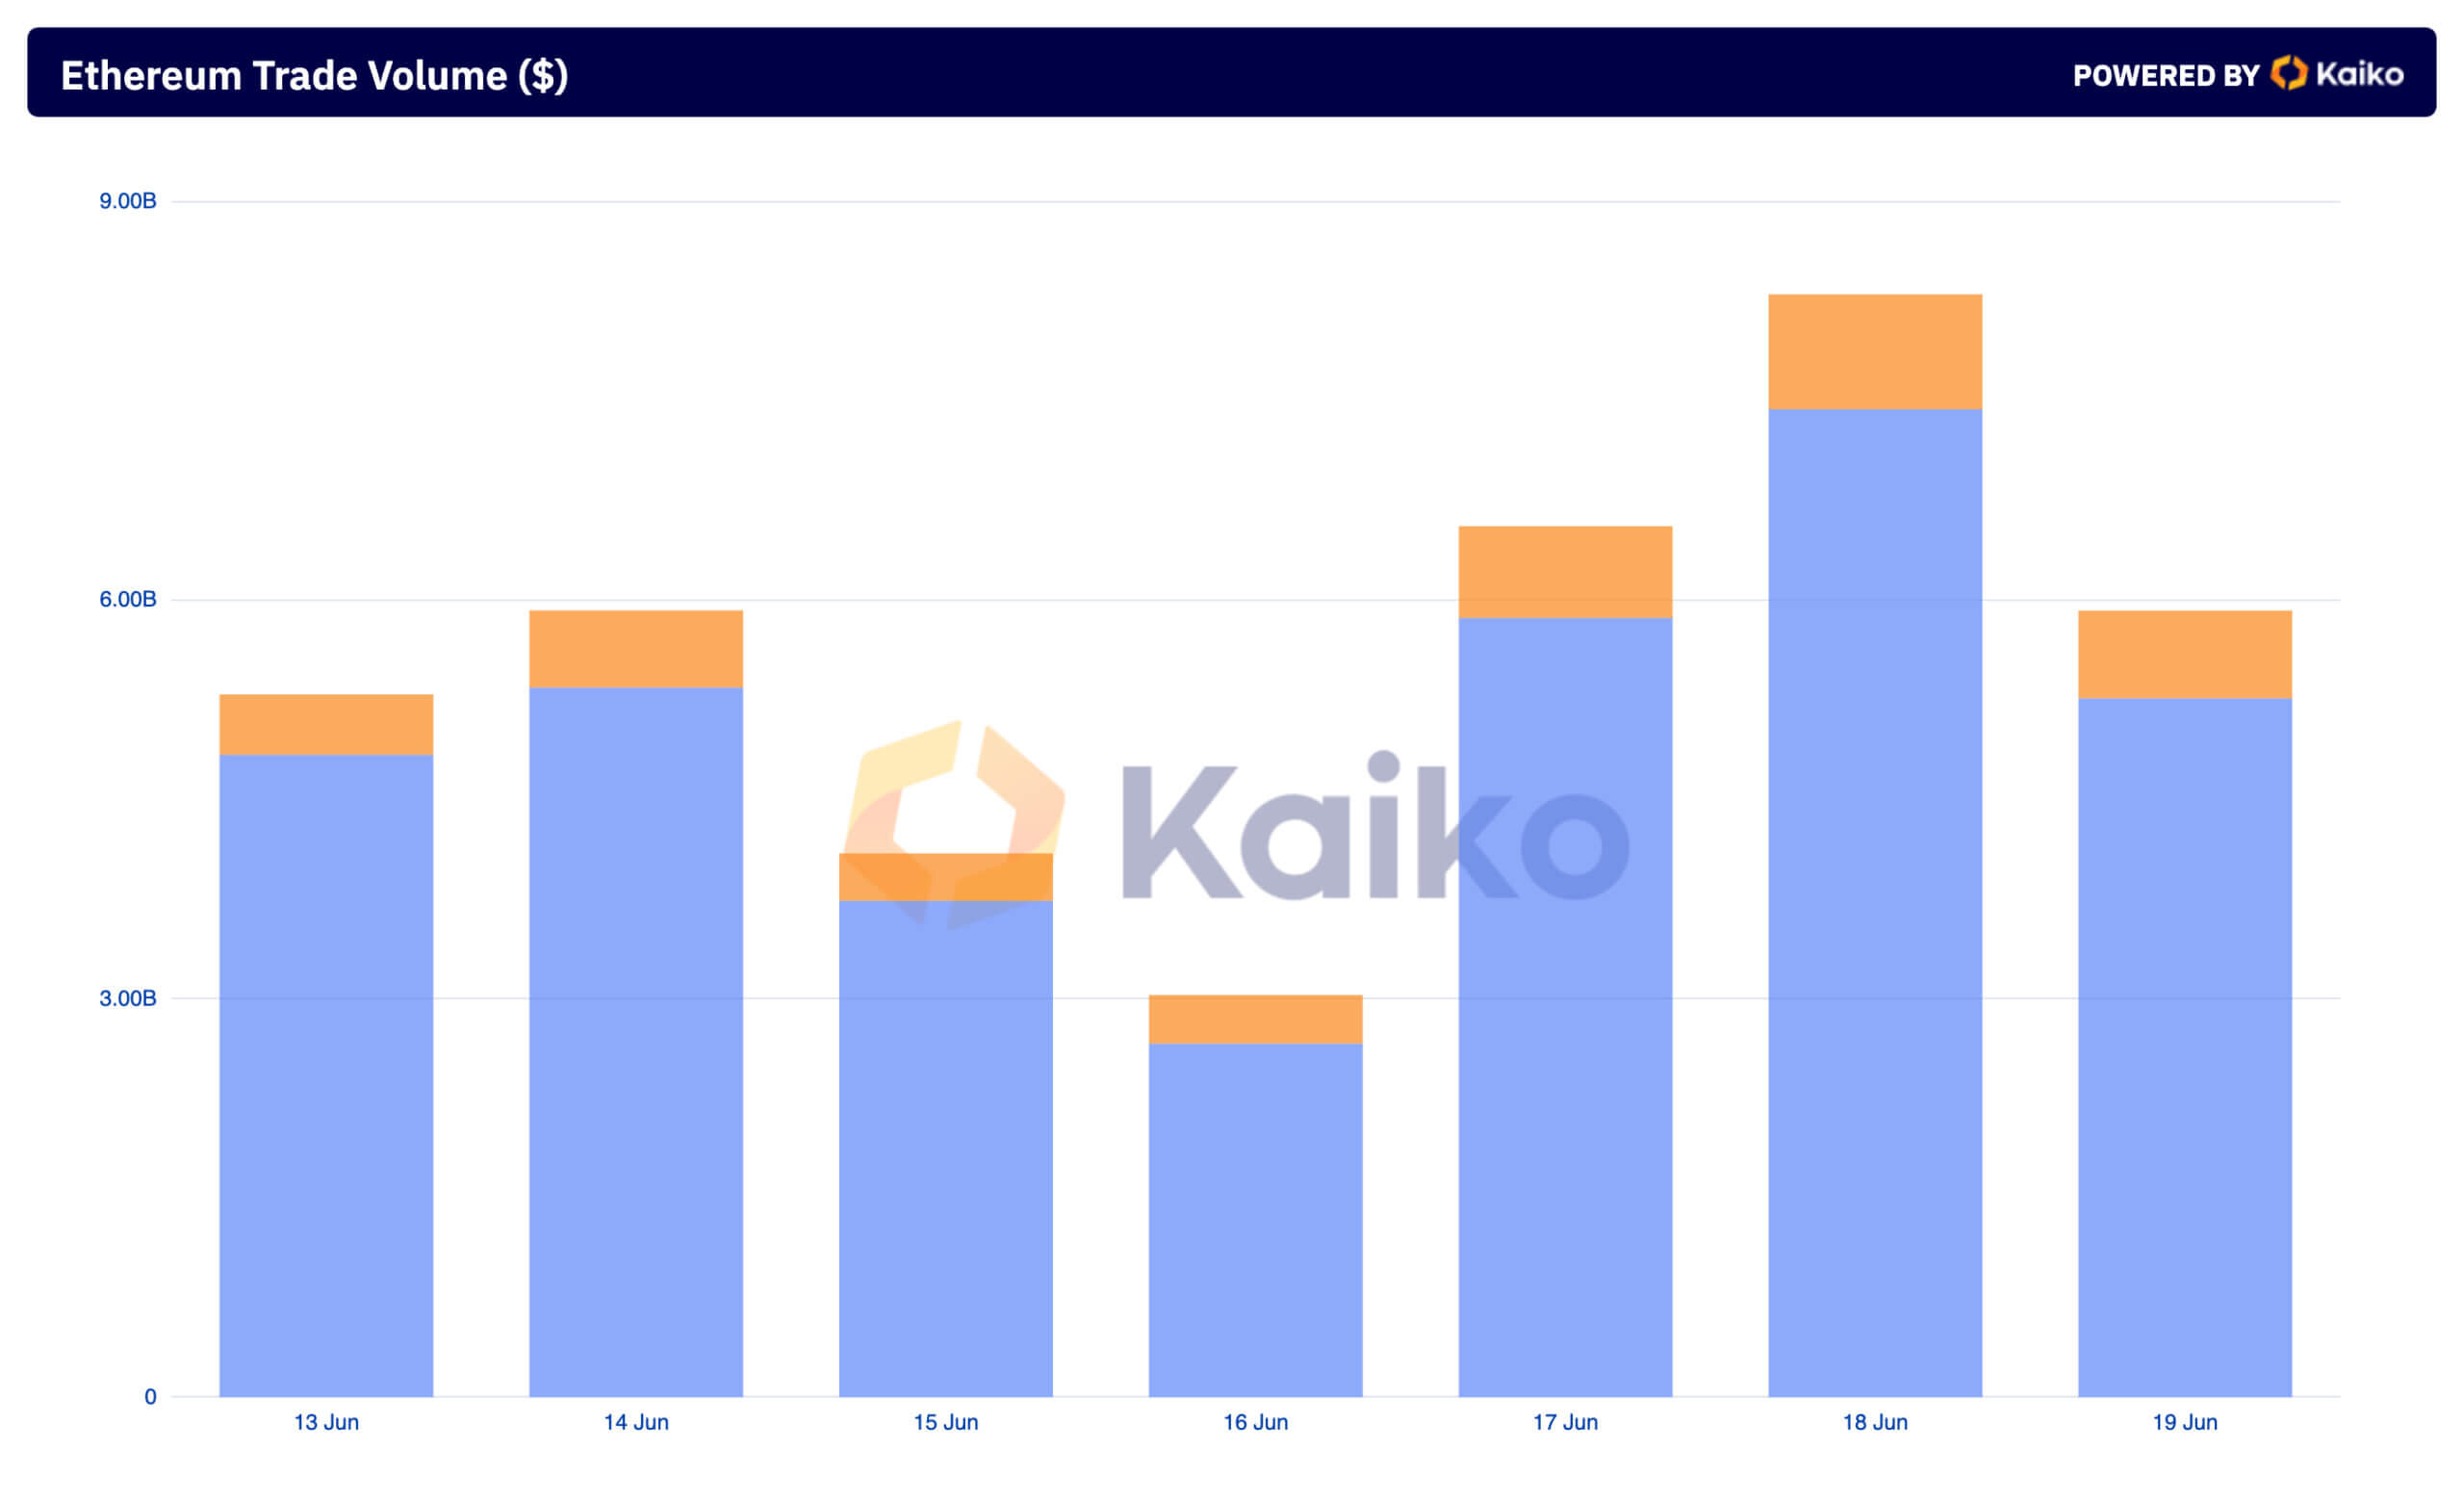
Despite the lack of significant volatility, the market saw fluctuating volume across both centralized (CEX) and decentralized exchanges (DEX). Notable spikes were identified on June 17 and June 18, suggesting periods of significantly heightened trading activity.
The high volumes on June 18, with $7.44 billion recorded on CEXs and $864.67 million on DEXs, show that the regulatory clarity granted to Ethereum contributed significantly to the trading activity.

The disparity between CEX and DEX volumes provides important insight into market preferences. Trading volumes on centralized exchanges have consistently outpaced those on decentralized ones despite Ethereum being the go-to DeFi hub.
This shows that despite the growth and adoption of DeFi, centralized exchanges still dominate the ETH market in terms of liquidity and trading activity. However, the steady volumes we’ve seen across decentralized exchanges in the past few weeks point to the growing resilience of this sector, which continues to serve an important subset of traders.
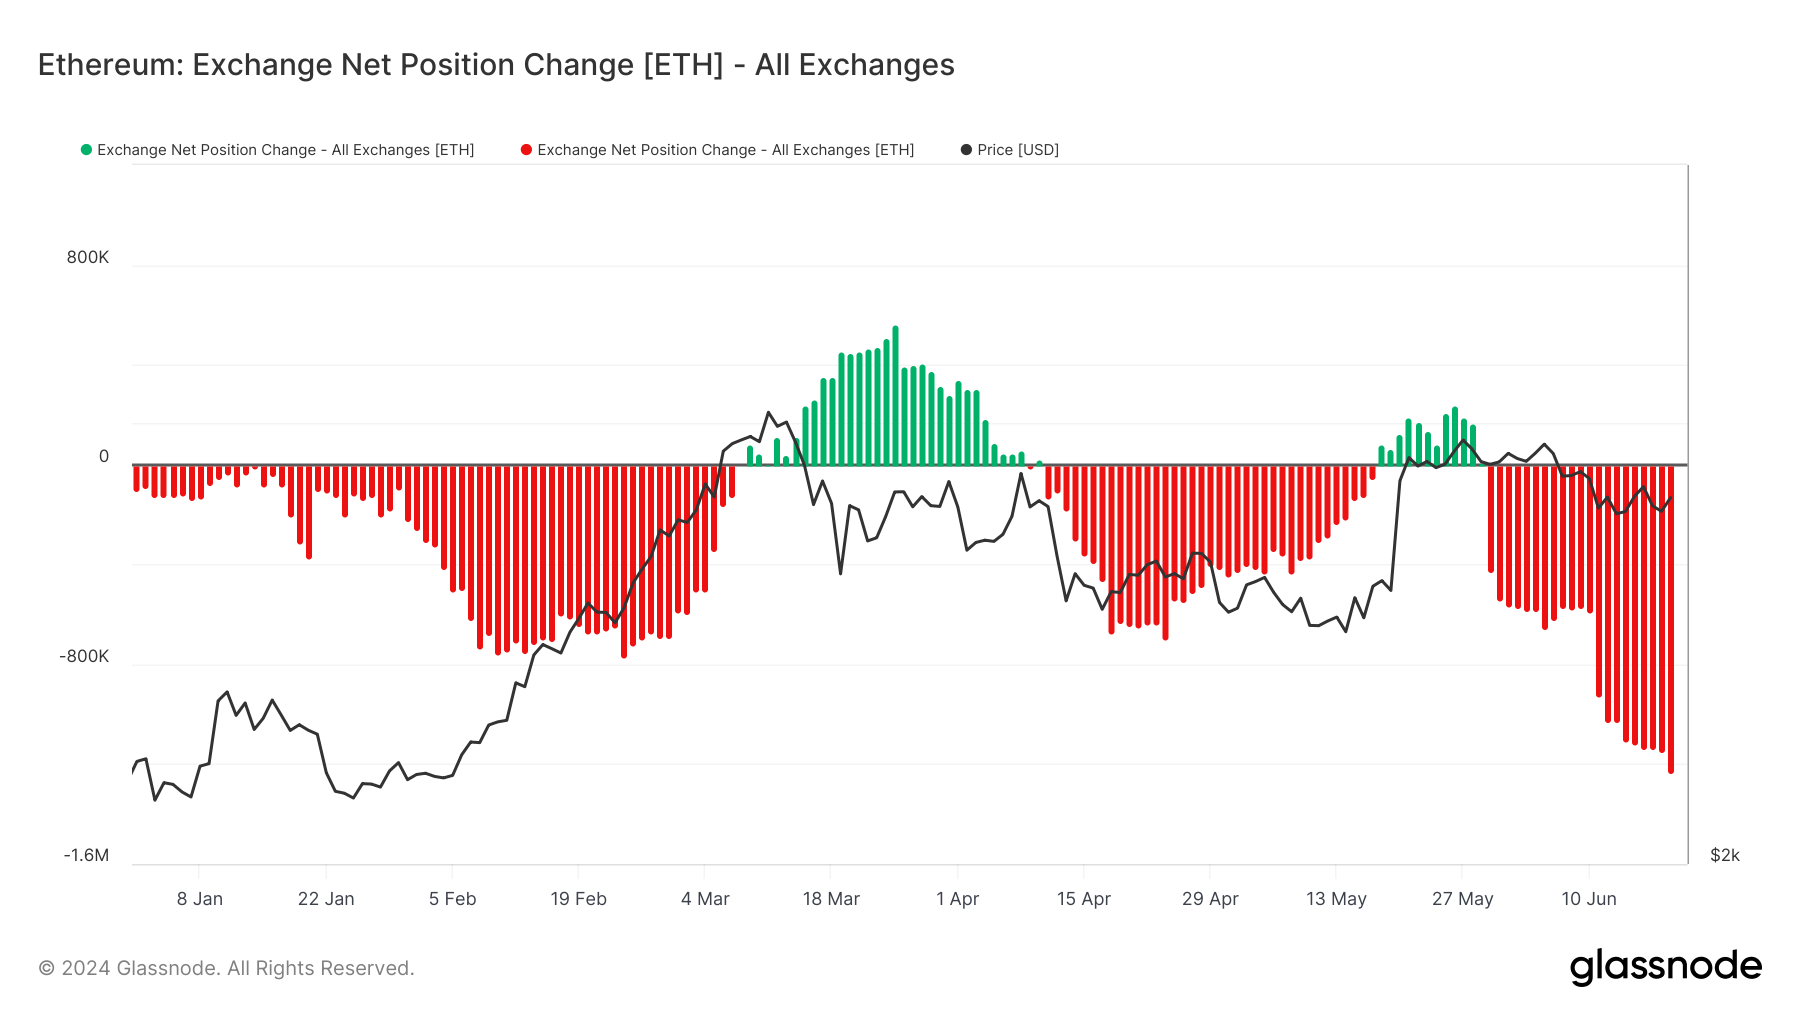
While it’s hard to determine a bullish or bearish trend from trading volume alone, exchange balances can better predict current and upcoming trends. Since the end of May, there has been a consistent decrease in the amount of ETH held in exchange wallets.
Zooming out to the rest of the year, we can see that the withdrawal trend dominates, broken only by two relatively short-lived bursts of exchange balance increases in March and May. On June 19, the market saw the largest 30-day negative change in exchange-held supply in almost a year, with 1.234 million ETH leaving exchanges.

As with Bitcoin, the consistent decrease in ETH held in exchange wallets typically aligns with a bullish outlook. Investors often withdraw assets from exchanges when they anticipate price appreciation. Holding assets off exchanges reduces the immediate supply available for trading, creating upward pressure on prices if demand remains consistent or increases.
This aligns with a previous CryptoSlate analysis, which identified a significant increase in long-term Ethereum holders. Long-term holders are typically less concerned with short-term volatility and are more focused on the asset’s fundamental value and long-term growth prospects.
Investors appear to be positioning themselves for potential upward movement, likely influenced by the recent positive regulatory developments and increasing institutional interest. The price stability observed may continue as the market digests these factors, potentially leading to a breakout if further positive news or significant developments occur.
However, the market’s reaction to external factors will also play a crucial role in price movements. Any negative news or regulatory setbacks could dampen the bullish sentiment and increase volatility.
The post Bullish sign for Ethereum as exchange balances drop appeared first on CryptoSlate.


