Data shows the Bitcoin Net Taker Volume has been mostly at negative levels recently. Here’s what this could mean for the asset’s price.
Bitcoin Net Taker Volume Has Been Mostly Negative In The Past Month
As CryptoQuant community manager Maartunn pointed out in a post on X, the Net Taker Volume suggests a lack of strong taker buy volume in the past month.
The “Net Taker Volume” is an indicator that keeps track of the difference between the Bitcoin taker buy and taker sell volumes. Naturally, the two volumes measure the buy and sell orders filled by takers in perpetual swaps.
When the value of this metric is positive, it means that the taker buy volume is greater than the taker sell volume right now. Such a trend implies the majority of the market shares a bullish sentiment.
On the other hand, the indicator under the zero mark suggests the dominance of a bearish mentality in the sector, as the short volume outweighs the long volume.
Now, here is a chart that shows the trend in the Bitcoin Net Taker Volume over the past month:
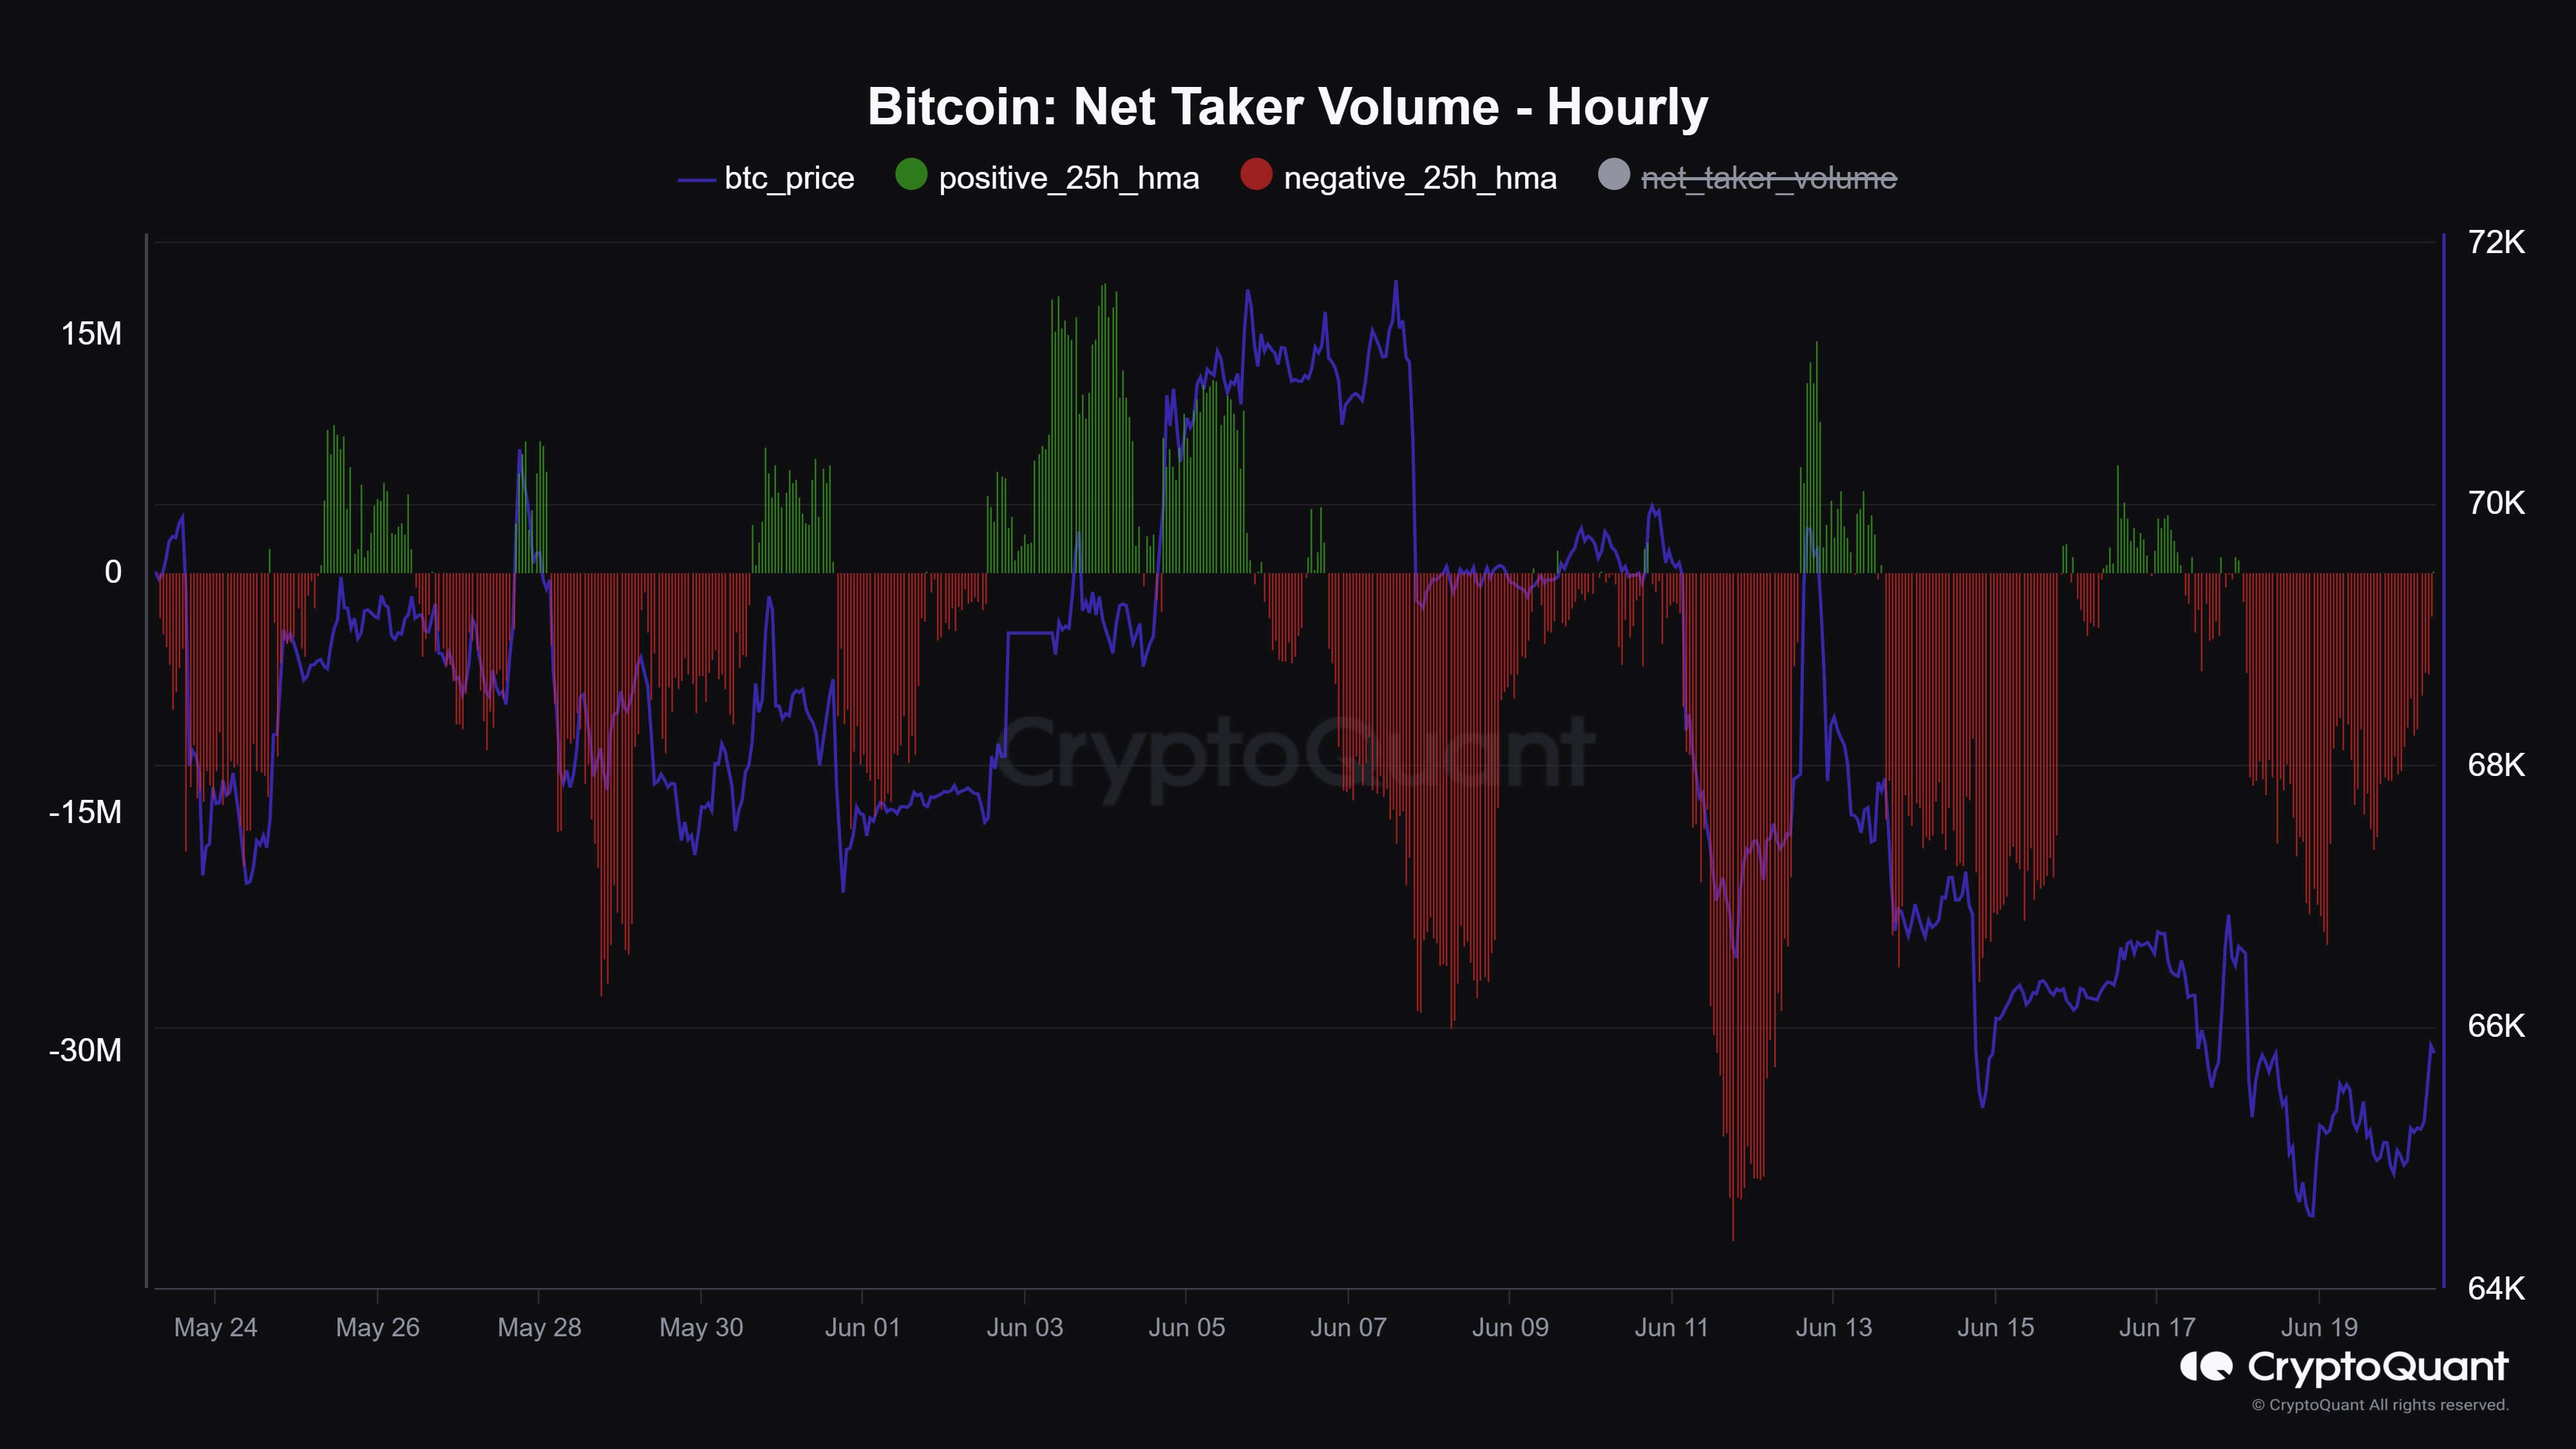
As displayed in the above graph, the Bitcoin Net Taker Volume has seen just a few spikes into positive territory during this window, and the scale of these spikes has also not been too great.
The indicator has been inside the red region the rest of the time, often observing significantly negative values. As such, it would appear that taker sell volume has dominated the market in the last month.
The graph shows that the one phase in this period where positive values reached a notable scale accompanied a rise in the cryptocurrency’s price. As such, the metric may need to flip green again if BTC has to make some recovery.
The net taker volume hasn’t been the only indicator that has been bearish for Bitcoin recently; it appears that the Coinbase Premium Gap has also been negative, as CryptoQuant founder and CEO Ki Young Ju shared in an X post.
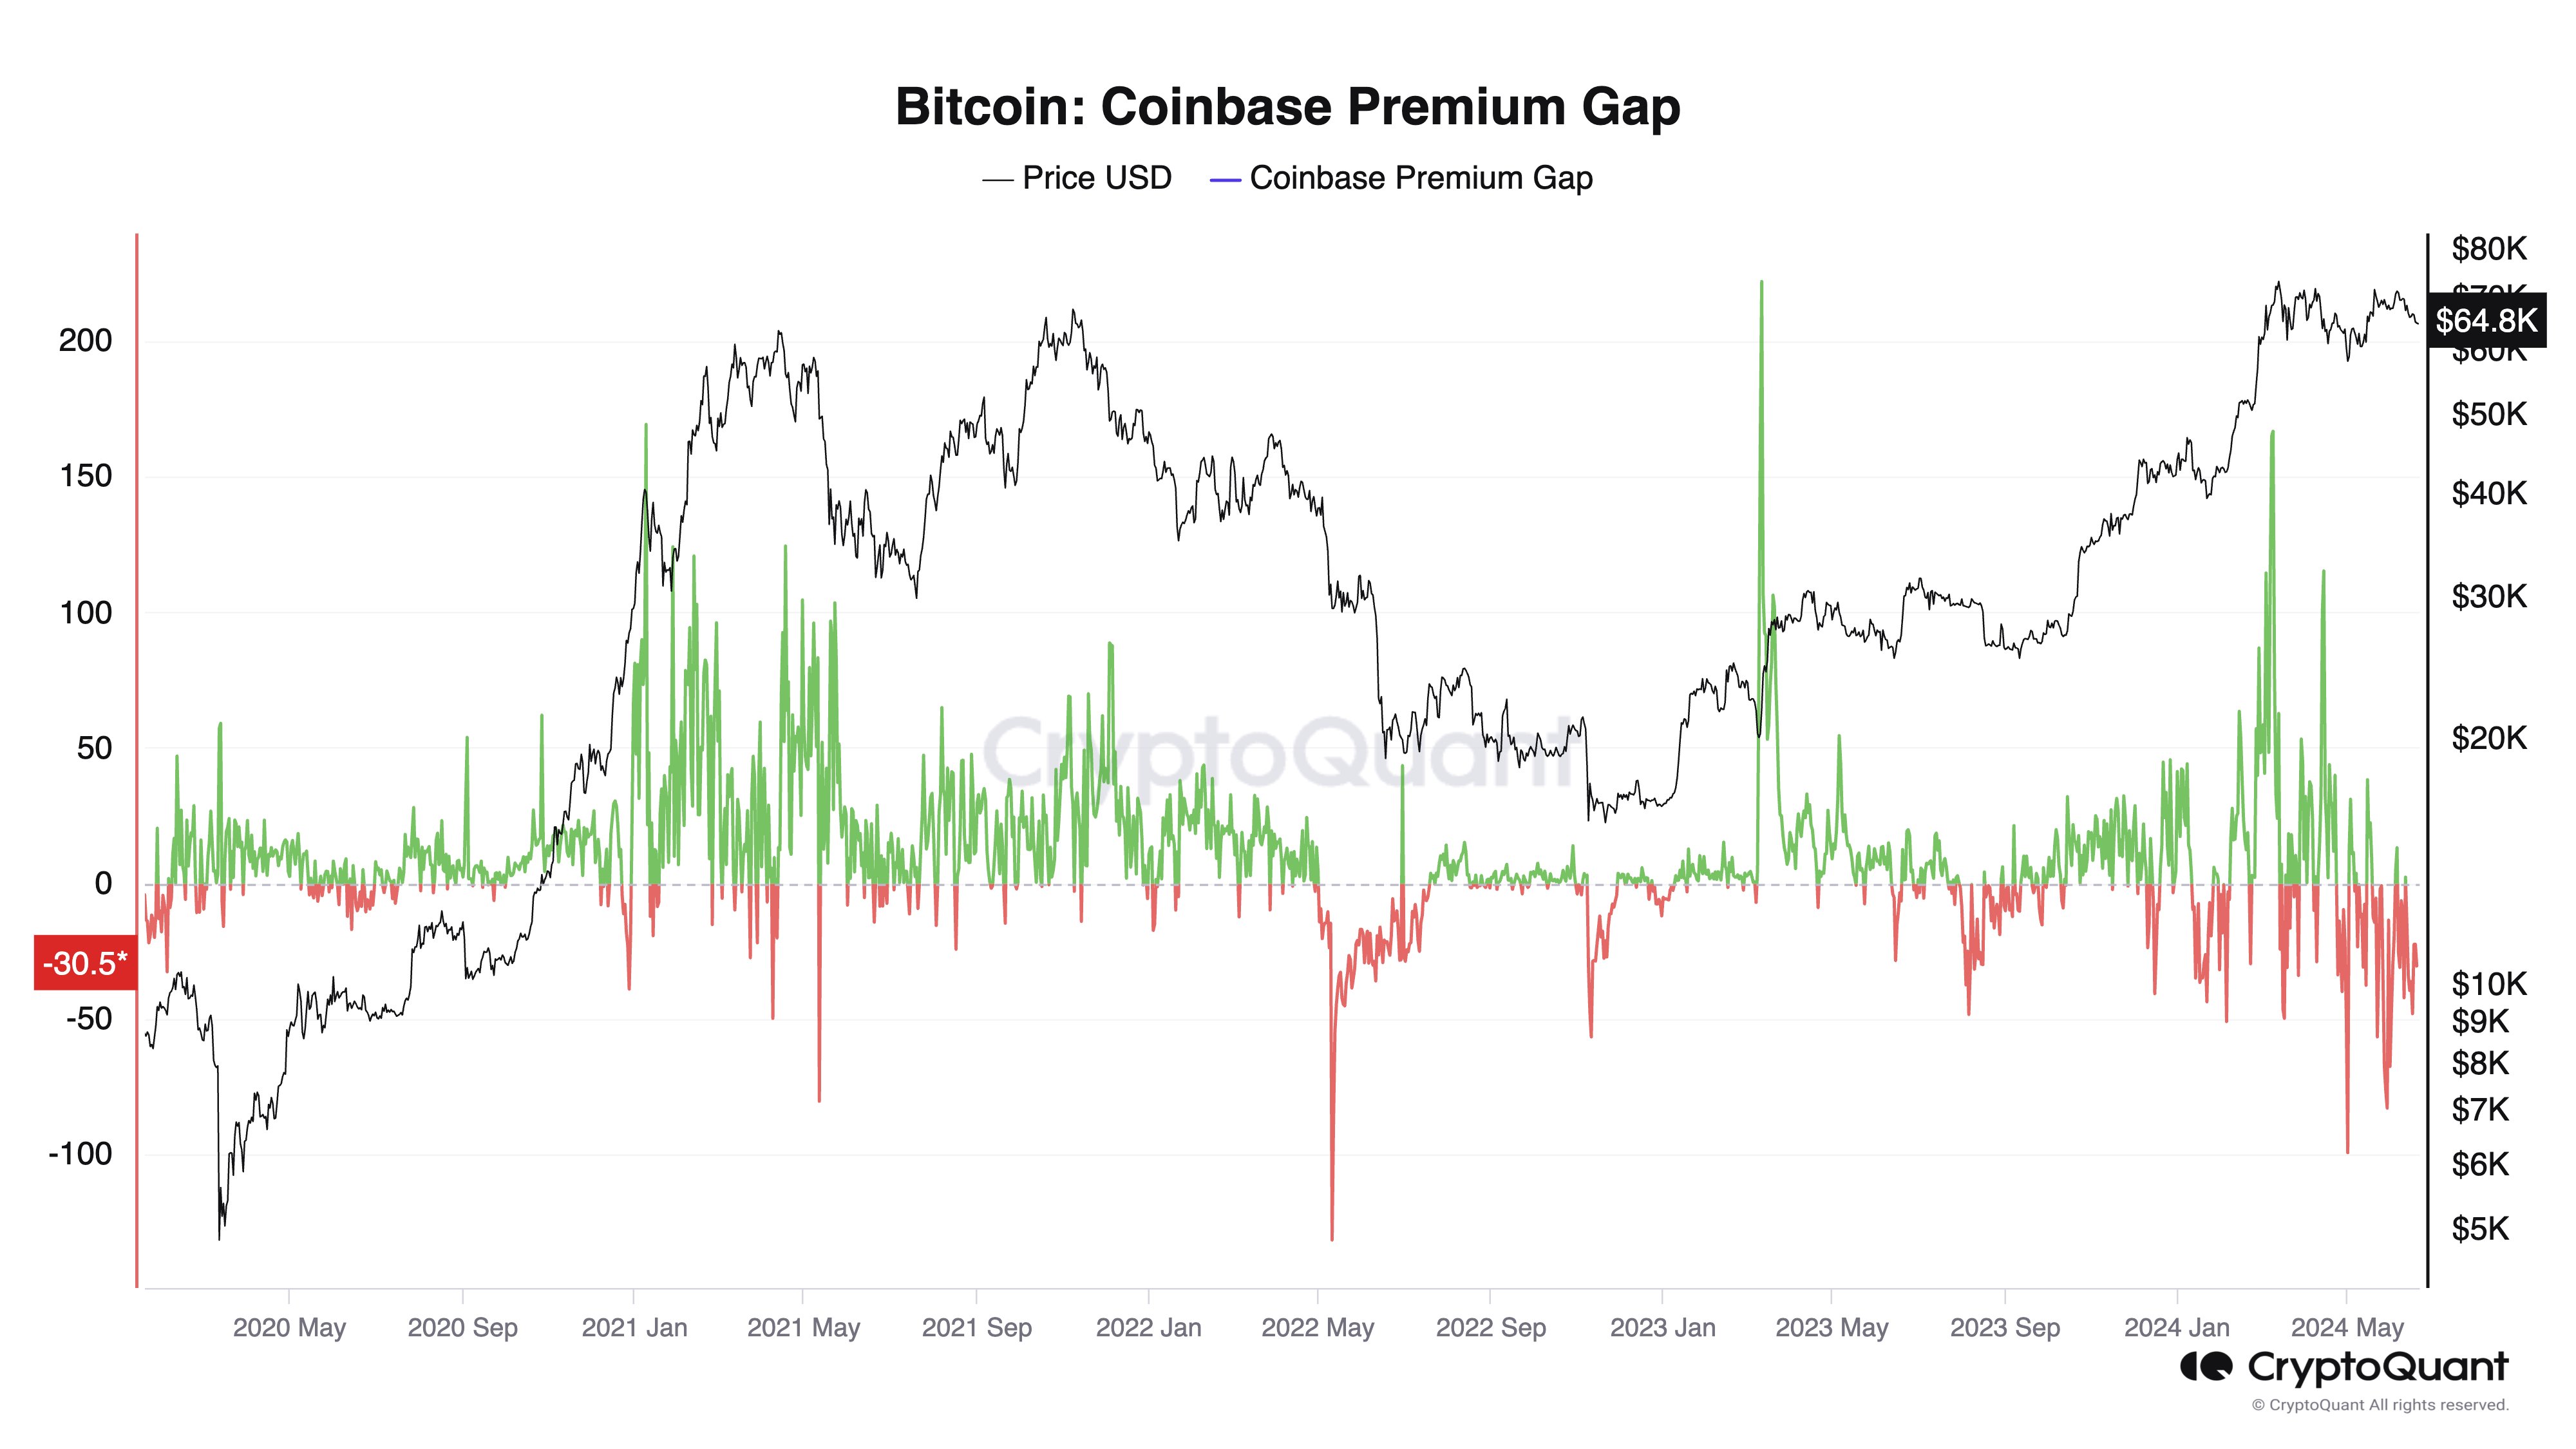
The Coinbase Premium Gap keeps track of the difference between the Bitcoin prices listed on the cryptocurrency exchanges Coinbase (USD pair) and Binance (USDT pair). The indicator’s value reflects how the investor behavior on Coinbase differs from that on Binance.
As the chart shows, the Bitcoin Coinbase Premium Gap has been sitting in underwater territory recently, suggesting that Coinbase has been seeing more selling pressure than Binance. This selling could be one of the reasons why the asset has been stuck in consolidation lately.
BTC Price
Bitcoin is trading around $64,800, which is within the range the asset has been moving sideways inside for a while now.


