XRP price climbed higher and tested the $0.4840 resistance zone. The price corrected gains but the bulls are able to protect the $0.4750 support.
- XRP price is eyeing an upside break above the $0.4840 resistance zone.
- The price is now trading above $0.4720 and the 100-hourly Simple Moving Average.
- There is a connecting bullish trend line forming with support at $0.4760 on the hourly chart of the XRP/USD pair (data source from Kraken).
- The pair might gain bullish momentum if there is a close above the $0.4840 resistance.
XRP Price Corrects Gains
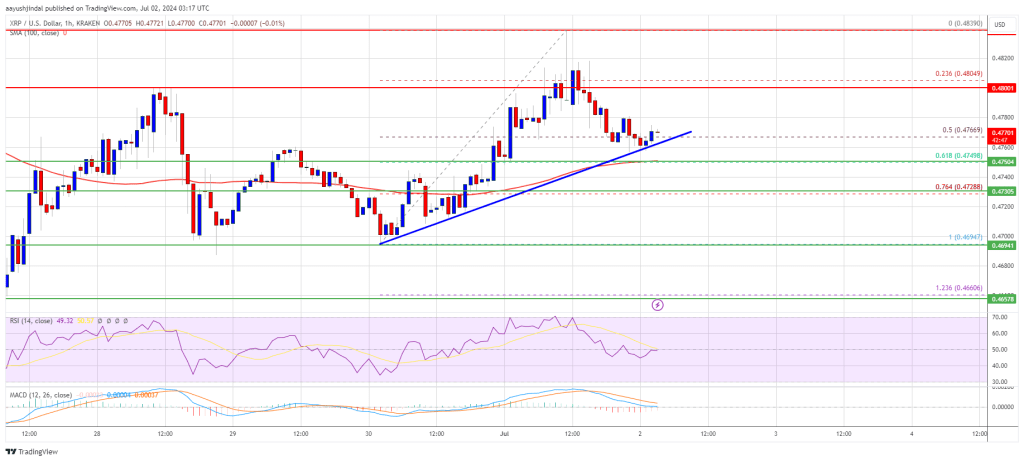
XRP price started a decent upward move above the $0.4740 resistance like Bitcoin and Ethereum. The bulls were able to push the price above $0.480. However, the bears were active near the $0.4840 resistance zone.
A high was formed at $0.4839 and the price recently started a downside correction. There was a move below the $0.4800 and $0.4780 levels. The price even spiked below the 50% Fib retracement level of the upward move from the $0.4695 swing low to the $0.4839 high.
It is now trading above $0.4740 and the 100-hourly Simple Moving Average. There is also a connecting bullish trend line forming with support at $0.4760 on the hourly chart of the XRP/USD pair.
On the upside, the price is facing resistance near the $0.480 level. The first major resistance is near the $0.4840 level. The next key resistance could be $0.4880. A clear move above the $0.4880 resistance might send the price toward the $0.5050 resistance.
The next major resistance is near the $0.5120 level. A close above the $0.5120 resistance zone could send the price higher toward $0.5250. Any more gains might send the price toward the $0.5320 resistance.
More Losses?
If XRP fails to clear the $0.4840 resistance zone, it could continue to move down. Initial support on the downside is near the $0.4765 level and the trend line.
The next major support is at $0.4740, the 61.8% Fib retracement level of the upward move from the $0.4695 swing low to the $0.4839 high, and the 100-hourly Simple Moving Average. If there is a downside break and a close below the $0.4740 level, the price might continue to decline toward the $0.4640 support in the near term.
Technical Indicators
Hourly MACD – The MACD for XRP/USD is now losing pace in the bullish zone.
Hourly RSI (Relative Strength Index) – The RSI for XRP/USD is now just below the 50 level.
Major Support Levels – $0.4765 and $0.4740.
Major Resistance Levels – $0.4800 and $0.4840.


