The Bitcoin price is already down more than -22% since the mid-March high over $73,000. While BTC is currently stabilizing above $57,000 following the recent price crash, there could be even more downside ahead if history repeats, according to Jacob Canfield, a trading mentor at the Trading Mastery. Canfield’s latest analysis points to a potential further decline in the Bitcoin price, potentially reaching lows not seen since the beginning of the year.
Why Bitcoin Price Could Crash Another 33%
Canfield’s analysis on TradingView hinges on historical patterns observed in Bitcoin’s pricing trends. “Historically, Bitcoin loves to retest the yearly open levels,” Canfield notes. According to him, these retests can either confirm bearish or bullish trends but are a consistent feature in Bitcoin’s market behavior. Since 2017, each year’s opening price has been retested within the year, with the notable exceptions of 2023 and 2024 (thus far).
“Since 2017, the yearly open has been retested every year except 2023 and 2024,” Canfield remarked. For instance, the bearish retest of the 2018 opening BTC price occurred right before the COVID-19 pandemic crash, and similar patterns were observed in subsequent years. “Even the 2019 yearly open at $3,850 was retested during the 2020 Covid Crash,” the crypto analyst added.
Moreover, the 2020 yearly open was retested within the first 3 months of 2020. The 2021 opening price was also retested and marked the lowest point before a significant rally that led to a peak of $69,000, just before the collapse of FTX. “The 2022 Yearly open was a bearish retest similar to 2018 before the lows around $16,500. Similar to the 2021 yearly open retest giving us our bottom, this gave us our local top,” Canfield observed.
Looking ahead, the crypto analyst speculates about the potential bottom for Bitcoin in the coming months. “Here is where it gets interesting. The 2023 and 2024 yearly opens have not been retested yet. The question is, do we form a bottom at the 2024 yearly open before more all time highs or do we capitulate all the way down to the 2023 yearly open at $16,500 like we did in 2019.”
Crucial Indicators To Watch
The answer may lie in several technical indicators that Canfield considers pivotal. First, Canfield mentions the 0.618 Fibonacci retracement level. This indicator aligns closely with the projected yearly open for 2024, suggesting a higher likelihood of finding support in the $38,000 to $42,000 range. Notably, a price crash this low would mean another -33% for BTC holders.
The second crucial indicator is the weekly 200 EMA/MA Ribbon. This indicator is also converging around the 2024 opening price. It reinforces the potential for this level to act as a strong support zone. “This gives us a higher probability that we will form a bottom around that region and the 2023 yearly open may act like the 2017 yearly open and never get retested,” Canfield speculates.
Despite the bearish outlook, Canfield’s analysis leaves room for various scenarios, emphasizing the cyclical nature of Bitcoin’s market dynamics and the role of historical precedents in forecasting future trends. “Either way, I think this gives us a high likelihood target based on historical precedence for where we may find a local bottom,” he concludes, inviting further discussion and analysis from the community.
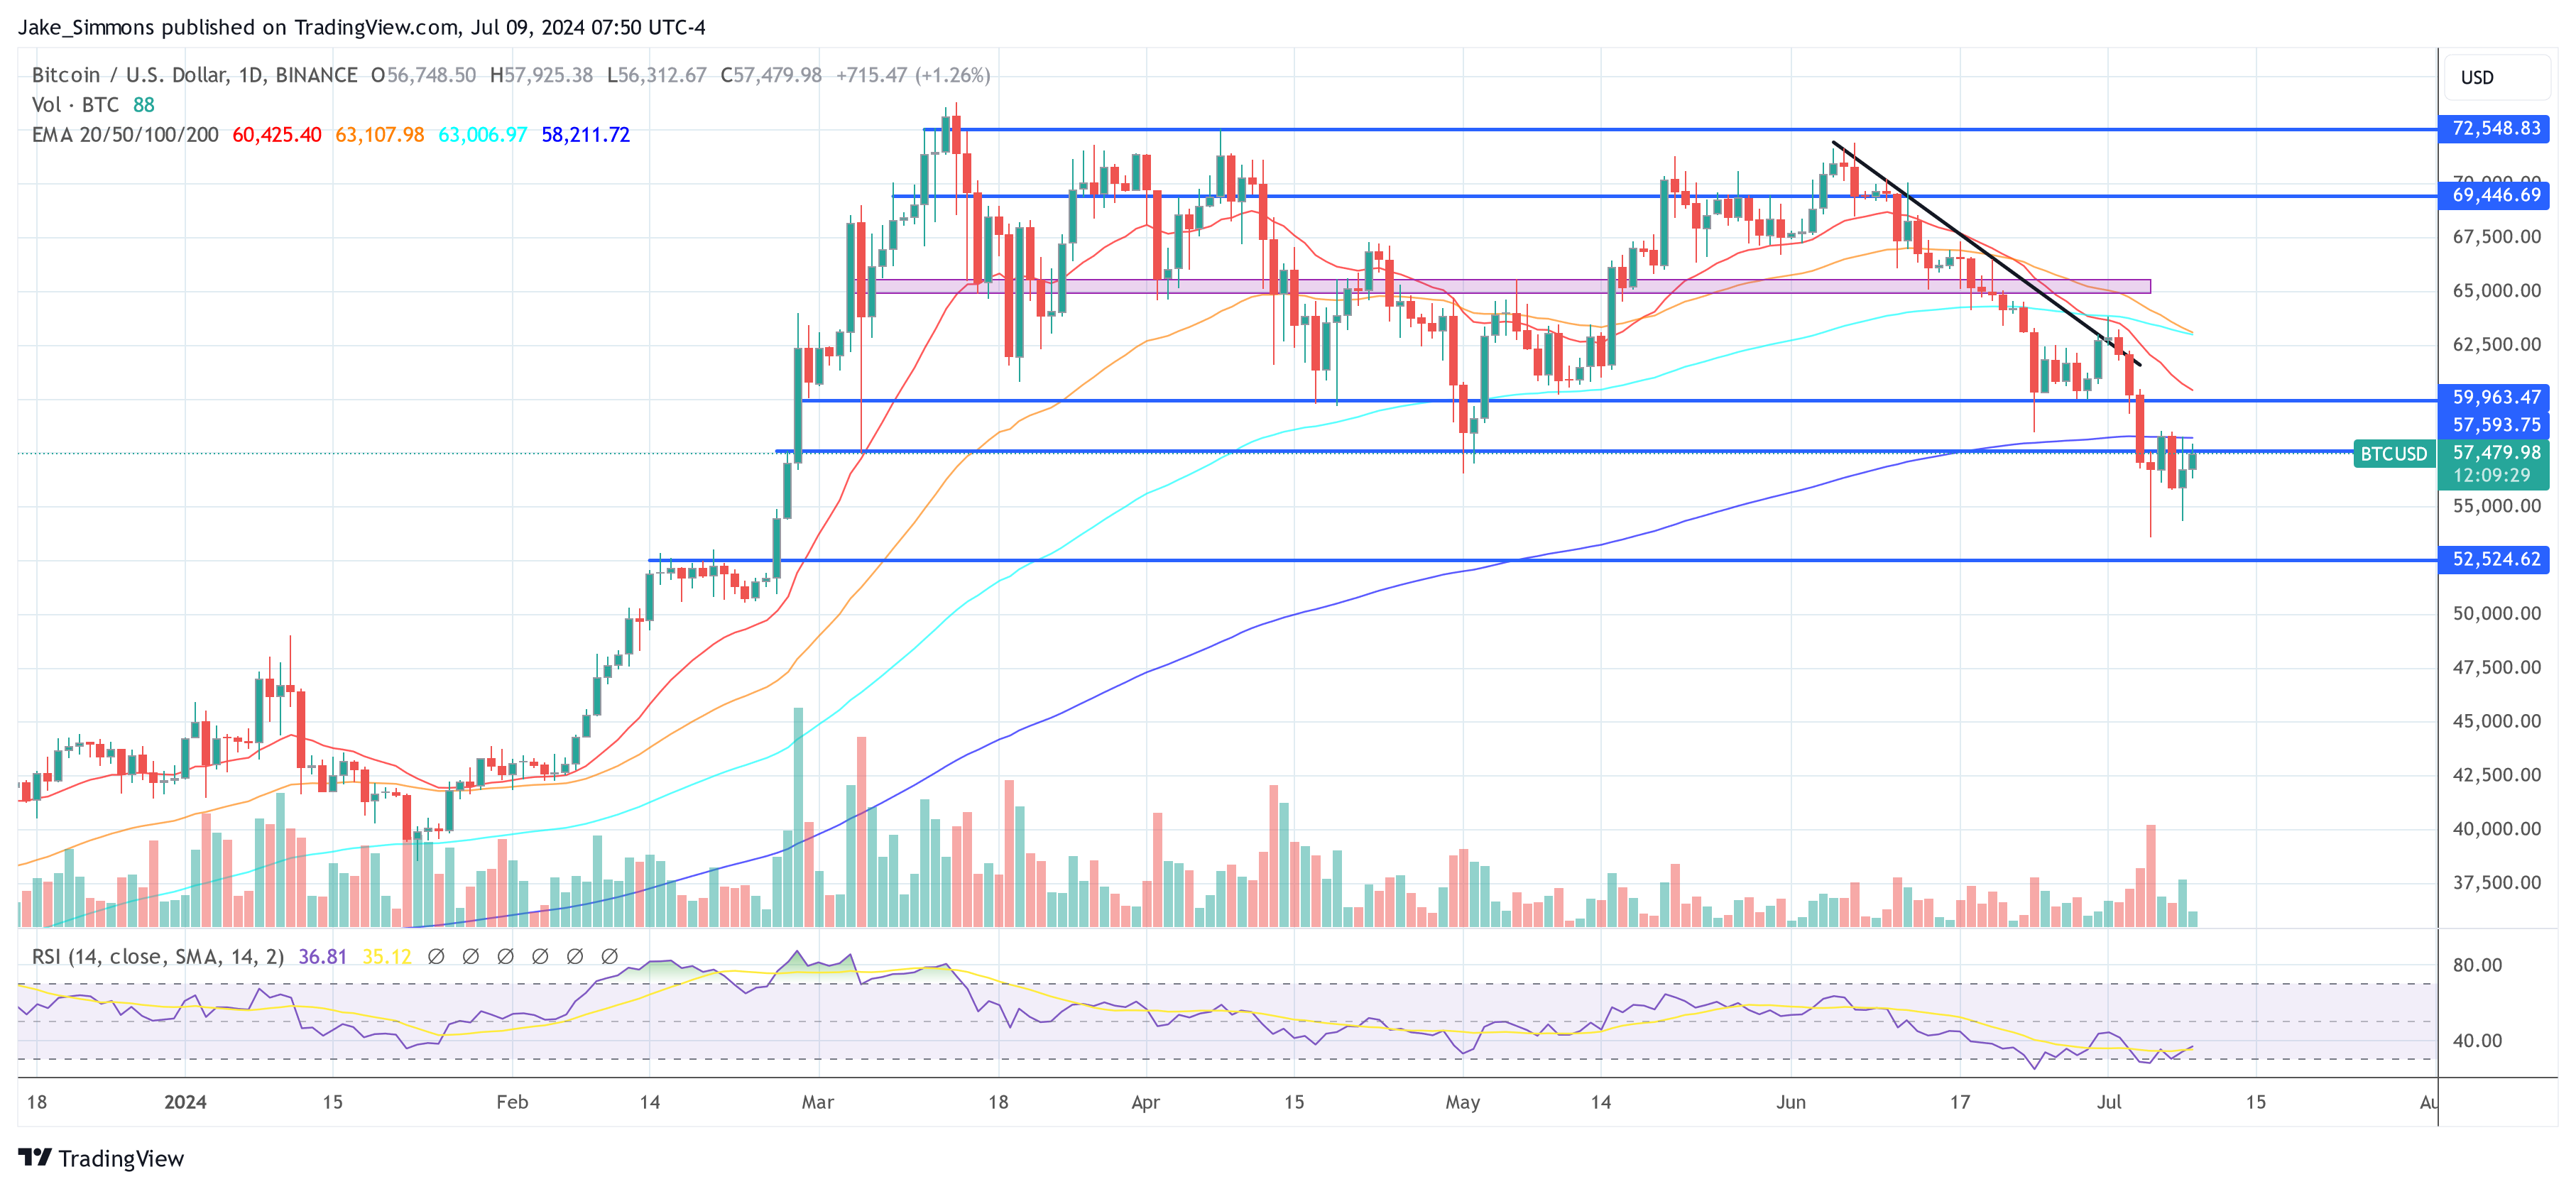
At press time, BTC traded at $57,479.