Bitcoin price gained over 15% and broke the $65,000 resistance level. BTC is still showing positive signs and might attempt to move above the $66,000 level.
- Bitcoin extended its increase above the $65,000 resistance zone.
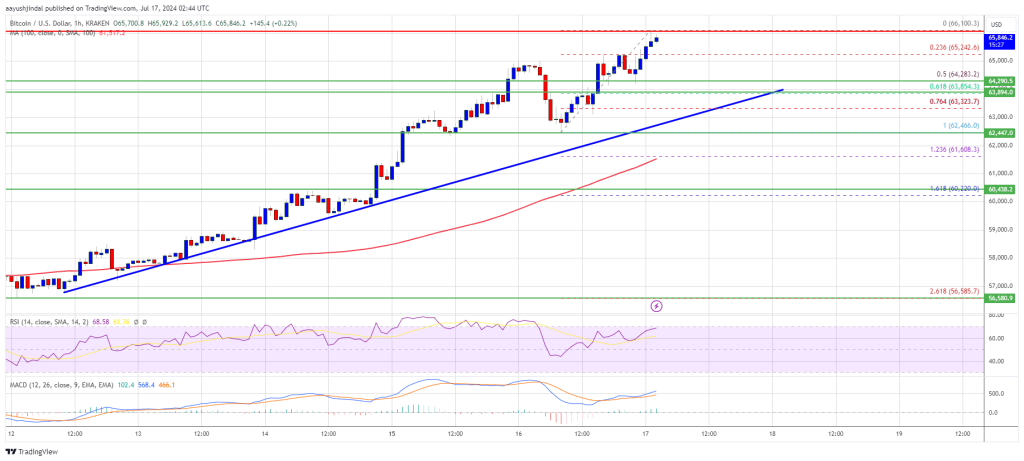
- The price is trading above $64,500 and the 100 hourly Simple moving average.
- There is a key bullish trend line forming with support at $63,850 on the hourly chart of the BTC/USD pair (data feed from Kraken).
- The pair might continue to move up if it breaks the $66,000 resistance.
Bitcoin Price Extends Increase, Bulls In Action
Bitcoin price remained in a bullish zone above the $62,500 and $63,500 resistance levels. BTC was able to surpass the $64,000 level to extend its increase. The bulls even pushed the price toward the $66,000 zone.
A high was formed at $66,100 and the price is now consolidating gains. It is trading well above the 23.6% Fib retracement level of the upward move from the $62,466 swing low to the $66,100 high. There is also a key bullish trend line forming with support at $63,850 on the hourly chart of the BTC/USD pair.
Bitcoin price is now trading above $64,500 and the 100 hourly Simple moving average. If there is an upside continuation, the price could face resistance near the $66,000 level. The first key resistance is near the $66,500 level.
A clear move above the $66,500 resistance might spark more bullish moves in the coming sessions. The next key resistance could be $67,200. The next major hurdle sits at $68,000. A close above the $68,000 resistance might push the price further higher. In the stated case, the price could rise and test the $70,000 resistance.
Are Dips Supported In BTC?
If Bitcoin fails to climb above the $66,000 resistance zone, it could start a downside correction. Immediate support on the downside is near the $66,000 level.
The first major support is $64,250 and the 50% Fib retracement level of the upward move from the $62,466 swing low to the $66,100 high. The next support is now near $63,650 and the trend line. Any more losses might send the price toward the $62,500 support zone in the near term.
Technical indicators:
Hourly MACD – The MACD is now gaining pace in the bullish zone.
Hourly RSI (Relative Strength Index) – The RSI for BTC/USD is now above the 50 level.
Major Support Levels – $64,250, followed by $63,850.
Major Resistance Levels – $66,000, and $67,200.


