Ethereum price extended losses and tested the $3,080 support zone. ETH is recovering and might aim for a test of the $3,350 resistance zone.
- Ethereum tested $3,080 and started a recovery wave.
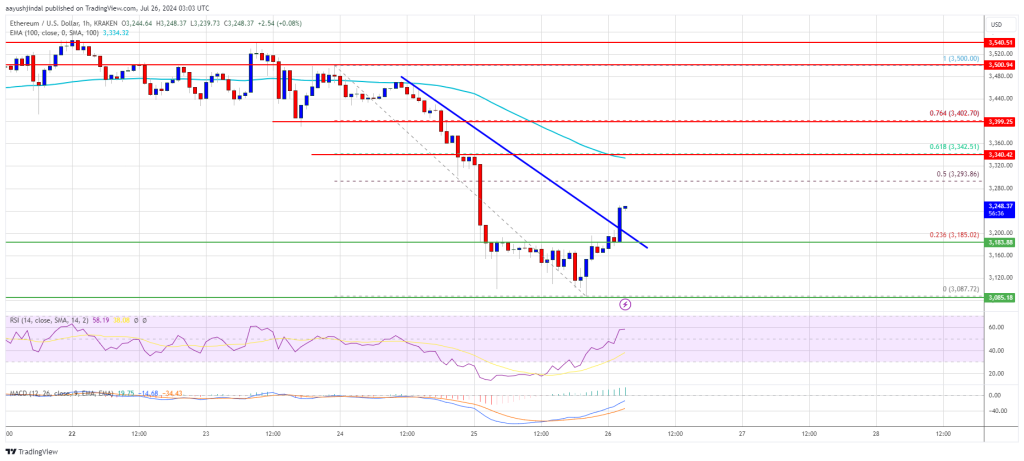
- The price is trading below $3,350 and the 100-hourly Simple Moving Average.
- There was a break above a connecting bearish trend line with resistance at $3,220 on the hourly chart of ETH/USD (data feed via Kraken).
- The pair could continue to move up if it stays above the $3,180 support zone.
Ethereum Price Recovers above $3,200
Ethereum price extended losses below the $3,250 support zone. ETH even declined below $3,150 and tested the $3,080 support zone. A low is formed at $3,087 and the price is now rising but lacks momentum like Bitcoin.
There was a move above the $3,200 resistance. The price cleared the 23.6% Fib retracement level of the downward move from the $3,500 swing high to the $3,087 low. Besides, there was a break above a connecting bearish trend line with resistance at $3,220 on the hourly chart of ETH/USD.
Ethereum is still trading below $3,350 and the 100-hourly Simple Moving Average. If there are more upsides, the price could face resistance near the $3,300 level.
The first major resistance is near the $3,350 level, the 100-hourly Simple Moving Average, and the 61.8% Fib retracement level of the downward move from the $3,500 swing high to the $3,087 low. The next major hurdle is near the $3,400 level. A close above the $3,400 level might send Ether toward the $3,500 resistance.
The next key resistance is near $3,550. An upside break above the $3,550 resistance might send the price higher toward the $3,720 resistance zone in the coming days.
Another Decline In ETH?
If Ethereum fails to clear the $3,300 resistance, it could start another decline. Initial support on the downside is near $3,185. The first major support sits near the $3,120 zone.
A clear move below the $3,120 support might push the price toward $3,080. Any more losses might send the price toward the $3,020 support level in the near term. The next key support sits at $2,950.
Technical Indicators
Hourly MACD – The MACD for ETH/USD is gaining momentum in the bullish zone.
Hourly RSI – The RSI for ETH/USD is now above the 50 zone.
Major Support Level – $3,185
Major Resistance Level – $3,350


