Menu

Categories:

Hot right now:

Follow on:

Coinsurges provides coverage of fintech, blockchain, and Bitcoin, delivering the most recent news and analyses on the future of money. Stay up-to-date with live prices, charts, and trading options for the top exchanges. Keep track of the day's top cryptocurrency gainers and losers, as well as which coins have experienced gains and losses in the past 24 hours.
Trust Coinsurges as your go-to source for all news and updates in the industry.

Analyst Says Chainlink Price Could Climb To $19 — Here’s How

Share This Post

In recent months, the Chainlink price hasn’t quite been able to replicate the bullish strength it showed at the start of the year. And the past week was a prime example of the coin’s recent struggles, as the bulls failed to completely stamp control over the last seven-day period.

However, it appears that the LINK price inconsistencies might be coming to an end soon, as a popular crypto analyst has identified a bullish pattern on the token’s price chart.

How LINK Price Could Soar 48% To Reach $19

Prominent crypto analyst Ali Martinez has shared — via a post on X — an exciting prognosis on the future trajectory of the Chainlink price. According to the crypto pundit, the cryptocurrency, which has largely struggled, could be set for a price turnaround over the next few weeks.

The rationale behind this bullish projection is the formation of an inverse head and shoulders pattern on the LINK four-hour price chart. The inverse head and shoulders formation is a technical analysis indicator that features a head (a lower low) in between two shoulders (usually a lower low and a higher low).

This chart formation — whether in the normal or inverse form — is a significant indicator for identifying trend reversals. Specifically, the inverse head and shoulder pattern suggests a shift from a bearish to a bullish trend when the price breaks the neckline, an imaginary line that runs through the peaks of the troughs.

Chainlink price

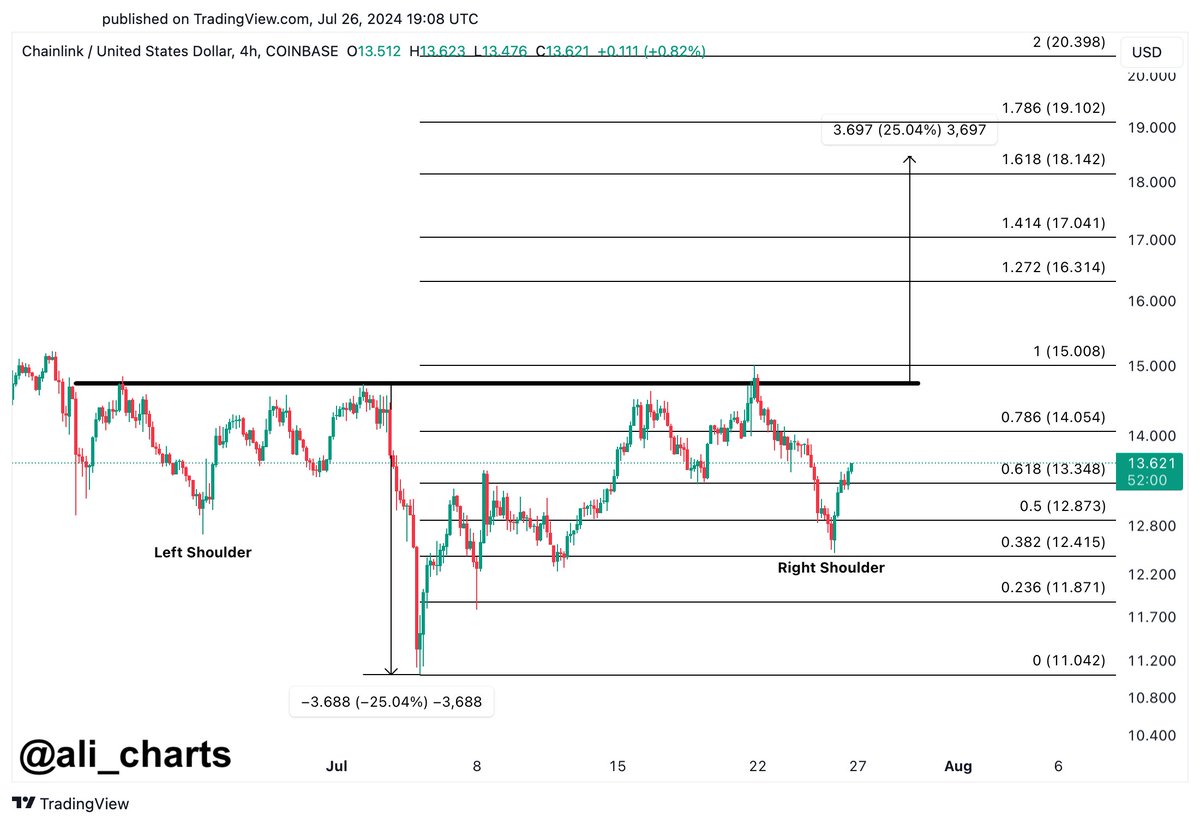
Martinez noted in his post on X that the price of Chainlink could make a run towards the $19 mark over the next coming days. However, the cryptocurrency must break above the neckline around the $15 level, as shown in the chart above.

A rally to the $19 mark would represent an almost 50% price leap from the current price. And a return to this price level would be most welcomed by the altcoin’s investors, having spent the last two months beneath it.

Chainlink Price At A Glance

As of this writing, the Chainlink price has jumped slightly above $13.5, reflecting a 3.6% increase in the last 24 hours. However, this price gain is not significant enough to wipe the token’s loss over the past seven days.

According to data from CoinGecko, the LINK token experienced a 3% decline in value in the past week. Nevertheless, the cryptocurrency still ranks among the top 20 largest assets in the sector, with a market cap of more than $8.2 billion.

Chainlink price

Read Entire Article
spot_img
- Advertisement -spot_img

Related Posts

Goldman Sachs Flags 35% Recession Risk — What This Means For Crypto

Crypto markets edged lower Monday following a stark warning from Goldman Sachs, which raised its 12-month US recession probability to 35%, citing rising tariffs, weakening growth, and deteriorating

Cap Labs Reveals Type III Stablecoins, Promising Smarter Yield Generation With No Human Oversight

The Stanford Blockchain Club published a paper on March 28 introducing “Type III Stablecoins,” a new category of yield-bearing stablecoins governed by autonomous smart contracts, developed by Cap

XRP Price Set For ‘Hot’ April With Low Fibonacci Levels And High $5-$8 Target

The past 24 hours have been challenging for XRP holders A sharp 58% decline in price has brought the asset close to testing critical support around $2, with selling pressure currently dominating

Solana Futures ETFs Fall Flat

Exchange-traded fund (ETF) service provider Volatility Shares launched two solana futures ETFs on March 20, the Solana ETF (SOLZ) and the 2x Solana ETF (SOLT) Both funds have had decent performance

Vitalik proposes new roadmap for Ethereum to enhance L2 security, finality

Ethereum co-founder Vitalik Buterin has proposed a new framework for Layer-2 (L2) rollup security that could bring faster finality and stronger trust guarantees to Ethereum’s scaling ecosystem In a

Pepe Whale Triggers Panic, Dumps 150 Billion Tokens As Price Falls

A big player in the world of Pepe coin has cashed out a large chunk of their holdings, causing the price of the meme coin to wobble This investor, who got in early on Pepe, sold off 150 billion
You have not selected any currencies to display