Entity-adjusted Bitcoin metrics provide a refined view of market sentiment by filtering out non-economic transactions. This is especially important when analyzing net unrealized profit and loss, such as the LTH-NUPL and STH-NUPL.
Non-entity-adjusted metrics can show skewed, unclear, or incorrect data because they include all transactions, even internal transfers within the same entity. These “in-house” transactions do not represent real economic activity but can artificially inflate or deflate the apparent level of unrealized profit or loss.
For instance, large internal transfers might create the illusion of increased market activity or profit-taking, resulting in false interpretations of market tops or bottoms and ultimately causing inaccurate market predictions.
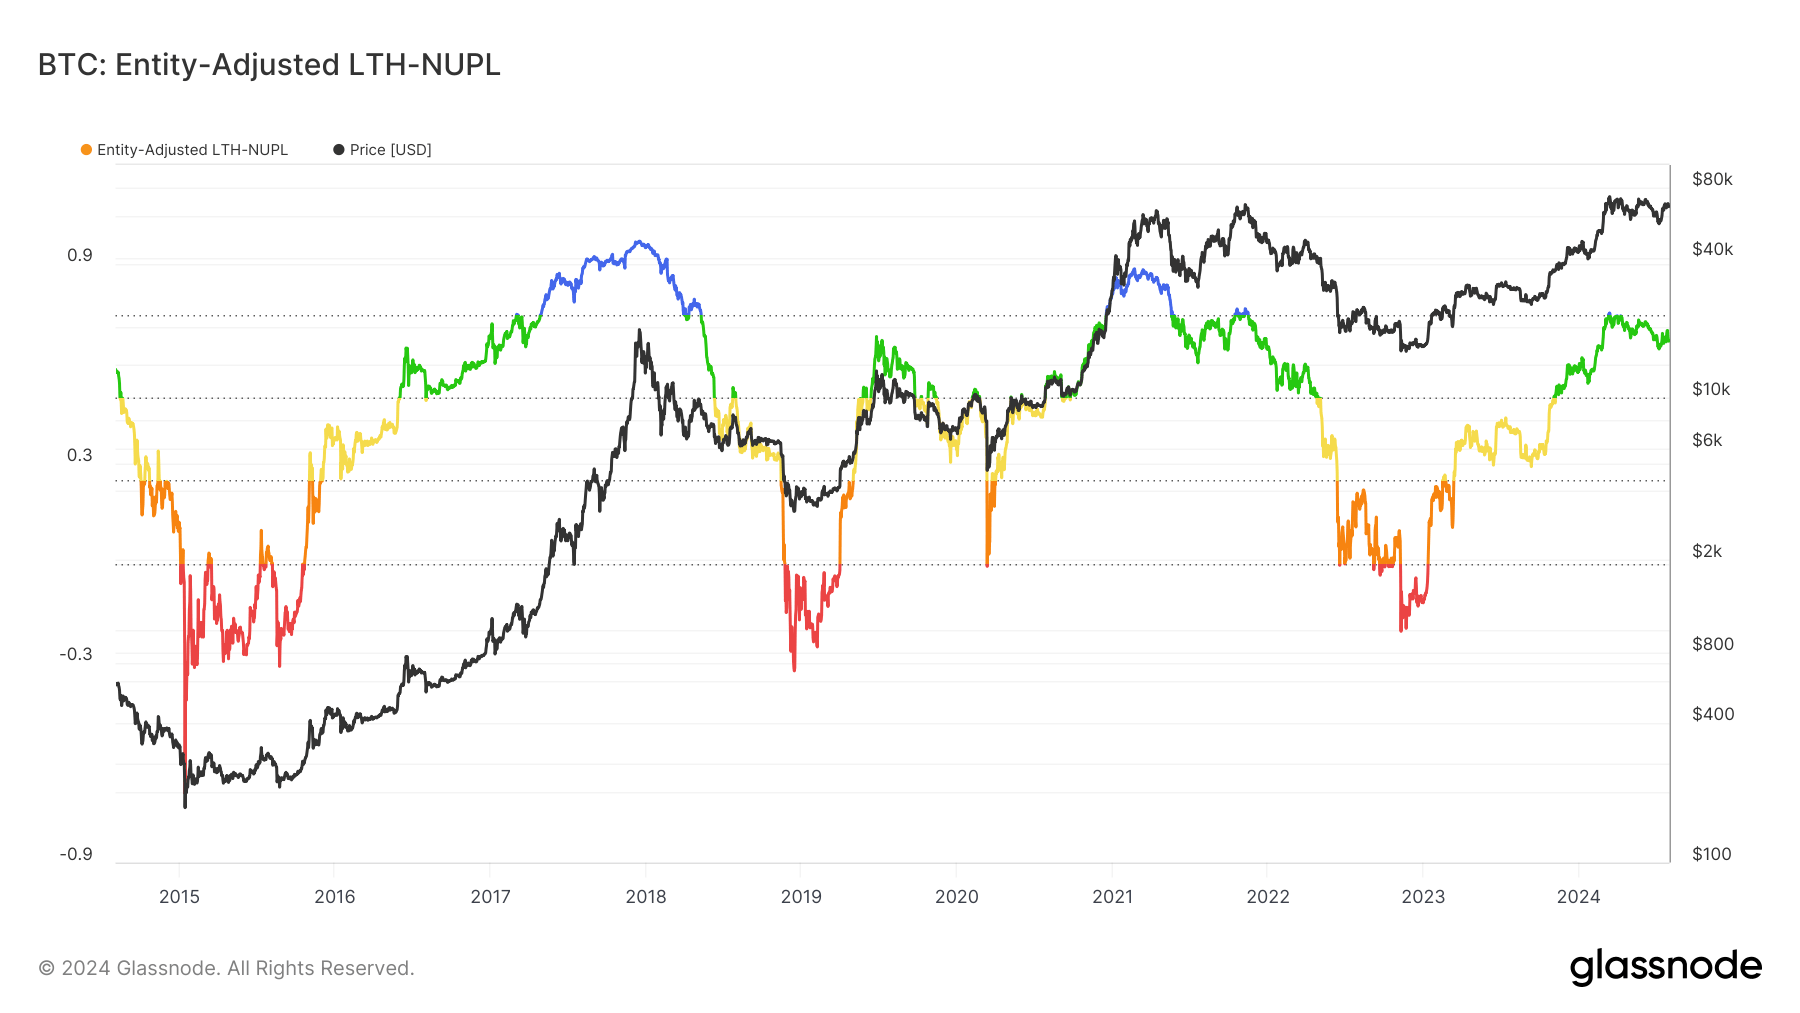
Entity-adjusted LTH-NUPL is an advanced metric that considers the actual economic activity of long-term holders by excluding these “in-house” transactions. This helps filter out activity from large institutional players that have become ubiquitous in the industry since the launch of spot Bitcoin ETFs.
Historically, LTH-NUPL has been a reliable indicator of market sentiment, particularly in identifying market tops and bottoms. When the LTH-NUPL crosses above 0.7, it typically signals the beginning of a euphoria or greed phase in the market. This phase often correlates with market tops as long-term holders realize significant unrealized profits. Conversely, values between 0.5 and 0.7 indicate a belief or denial phase, depending on the price direction.
In 2024, LTH-NUPL has consistently remained above 0.5, suggesting a strong belief in the market’s upward trend among long-term holders. The metric briefly crossed into the greed phase from May 11 to May 13, showing a short-lived euphoria as Bitcoin reached its new all-time high.
Since July, LTH-NUPL has been trending upwards with significant volatility, reaching 0.70 on July 27 before slightly decreasing to 0.66 by July 31.
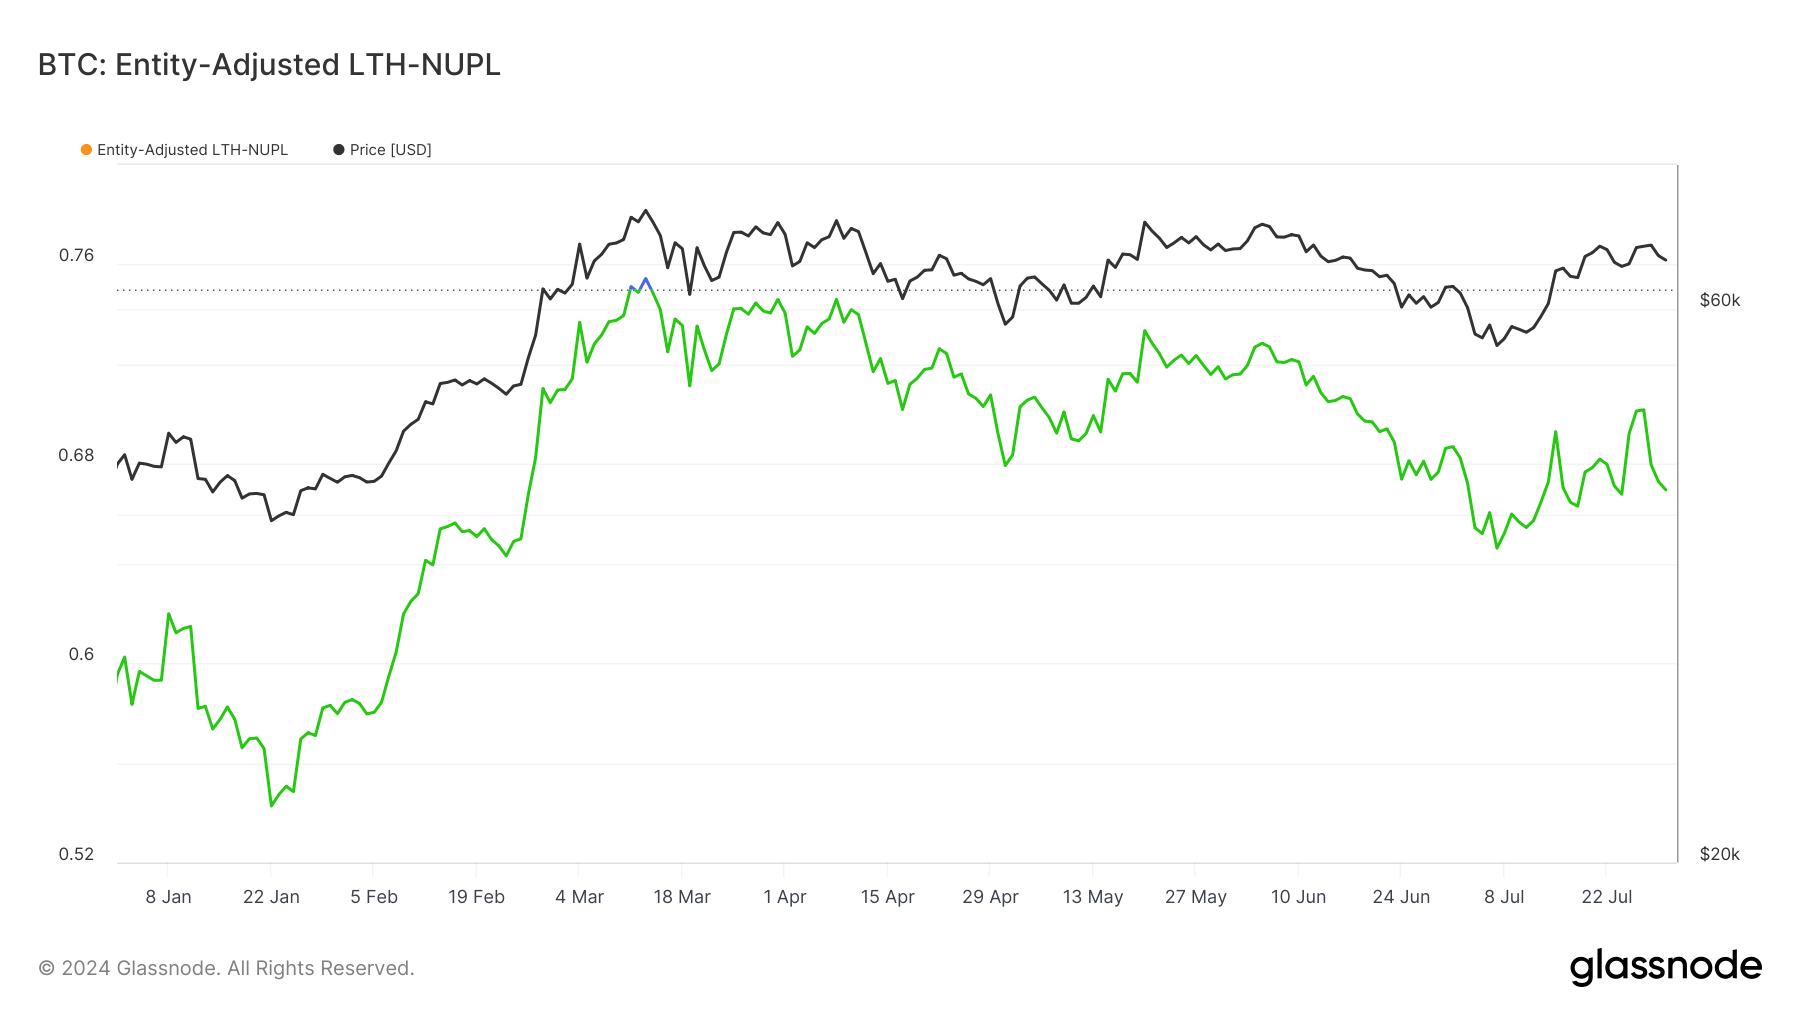
This upward trend in LTH-NUPL reflects the confidence of long-term holders in the ongoing market rally despite the occasional volatility. The metric’s resilience above 0.5 throughout the year shows the cohort’s sustained belief.
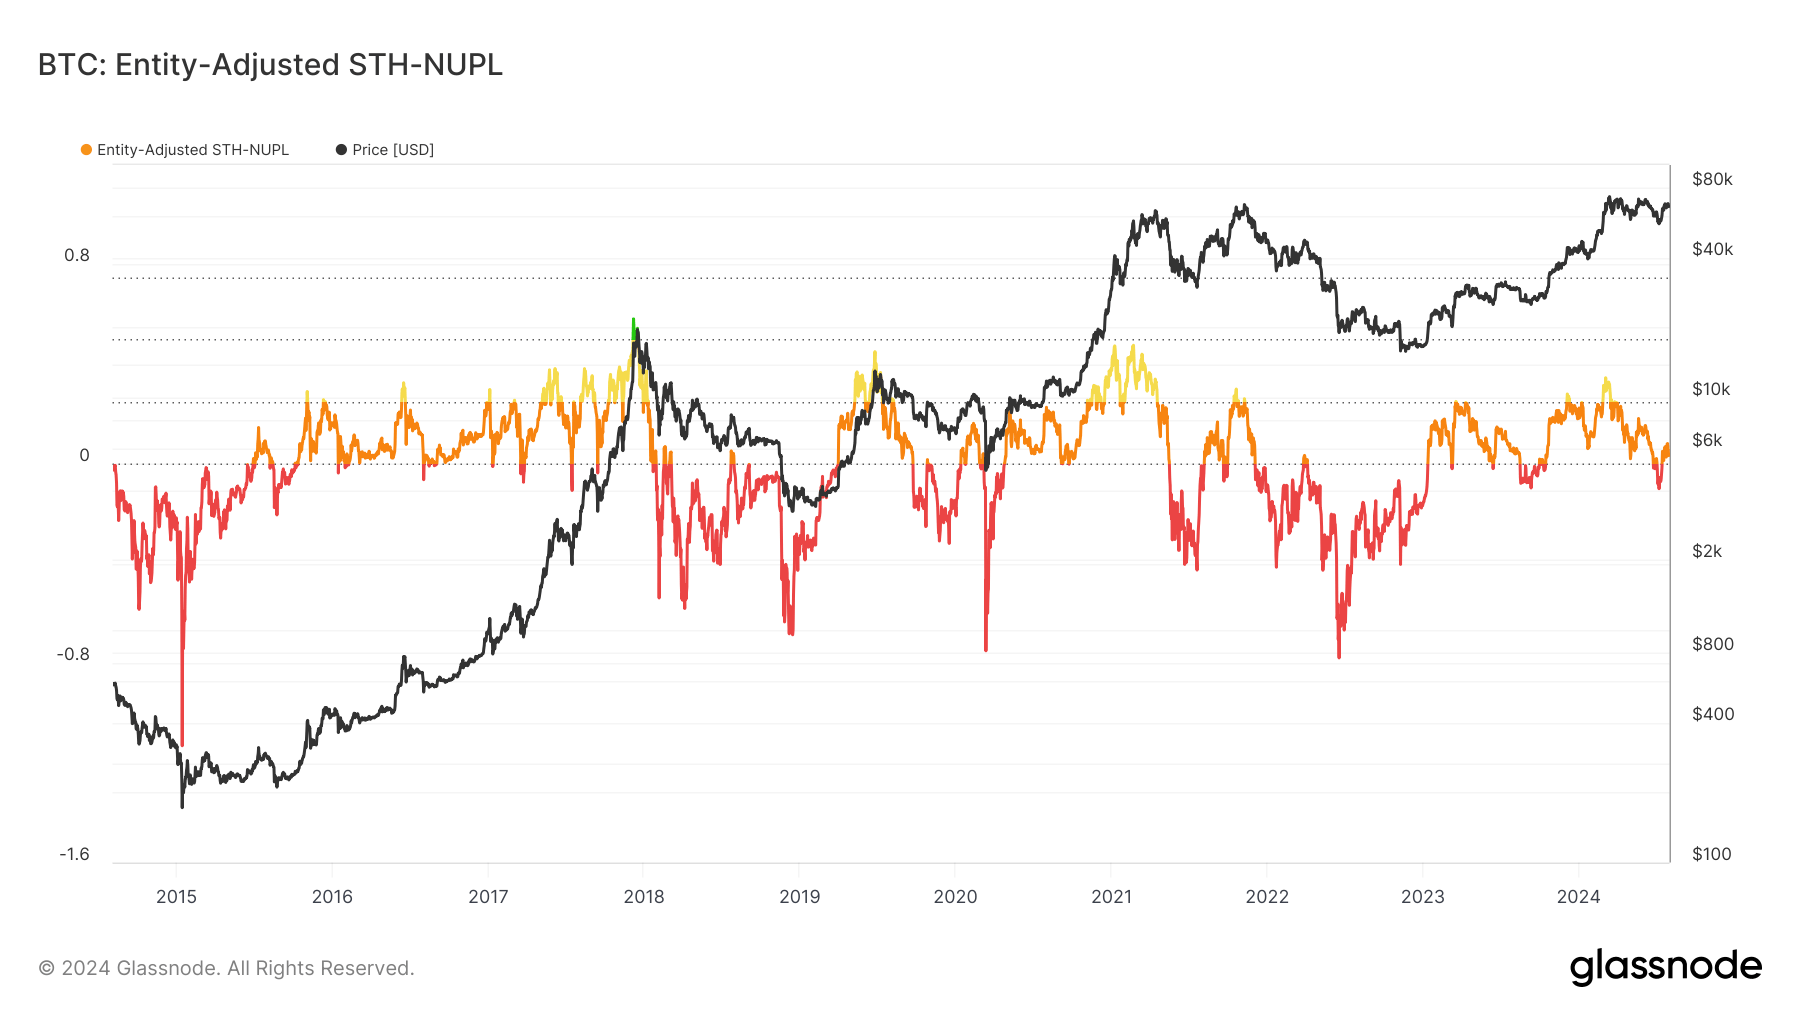
Entity-adjusted STH-NUPL, on the other hand, measures the net unrealized profit or loss of short-term holders, defined as entities holding Bitcoin for less than 155 days. Historically, STH-NUPL has been less effective in predicting market tops and bottoms than LTH-NUPL.
During Bitcoin’s bull run in December 2017, STH-NUPL briefly entered the belief/denial phase. However, it has mostly ranged between 0 and 0.24, indicating a state of hope or fear among short-term holders, with extreme volatility corresponding to price movements.
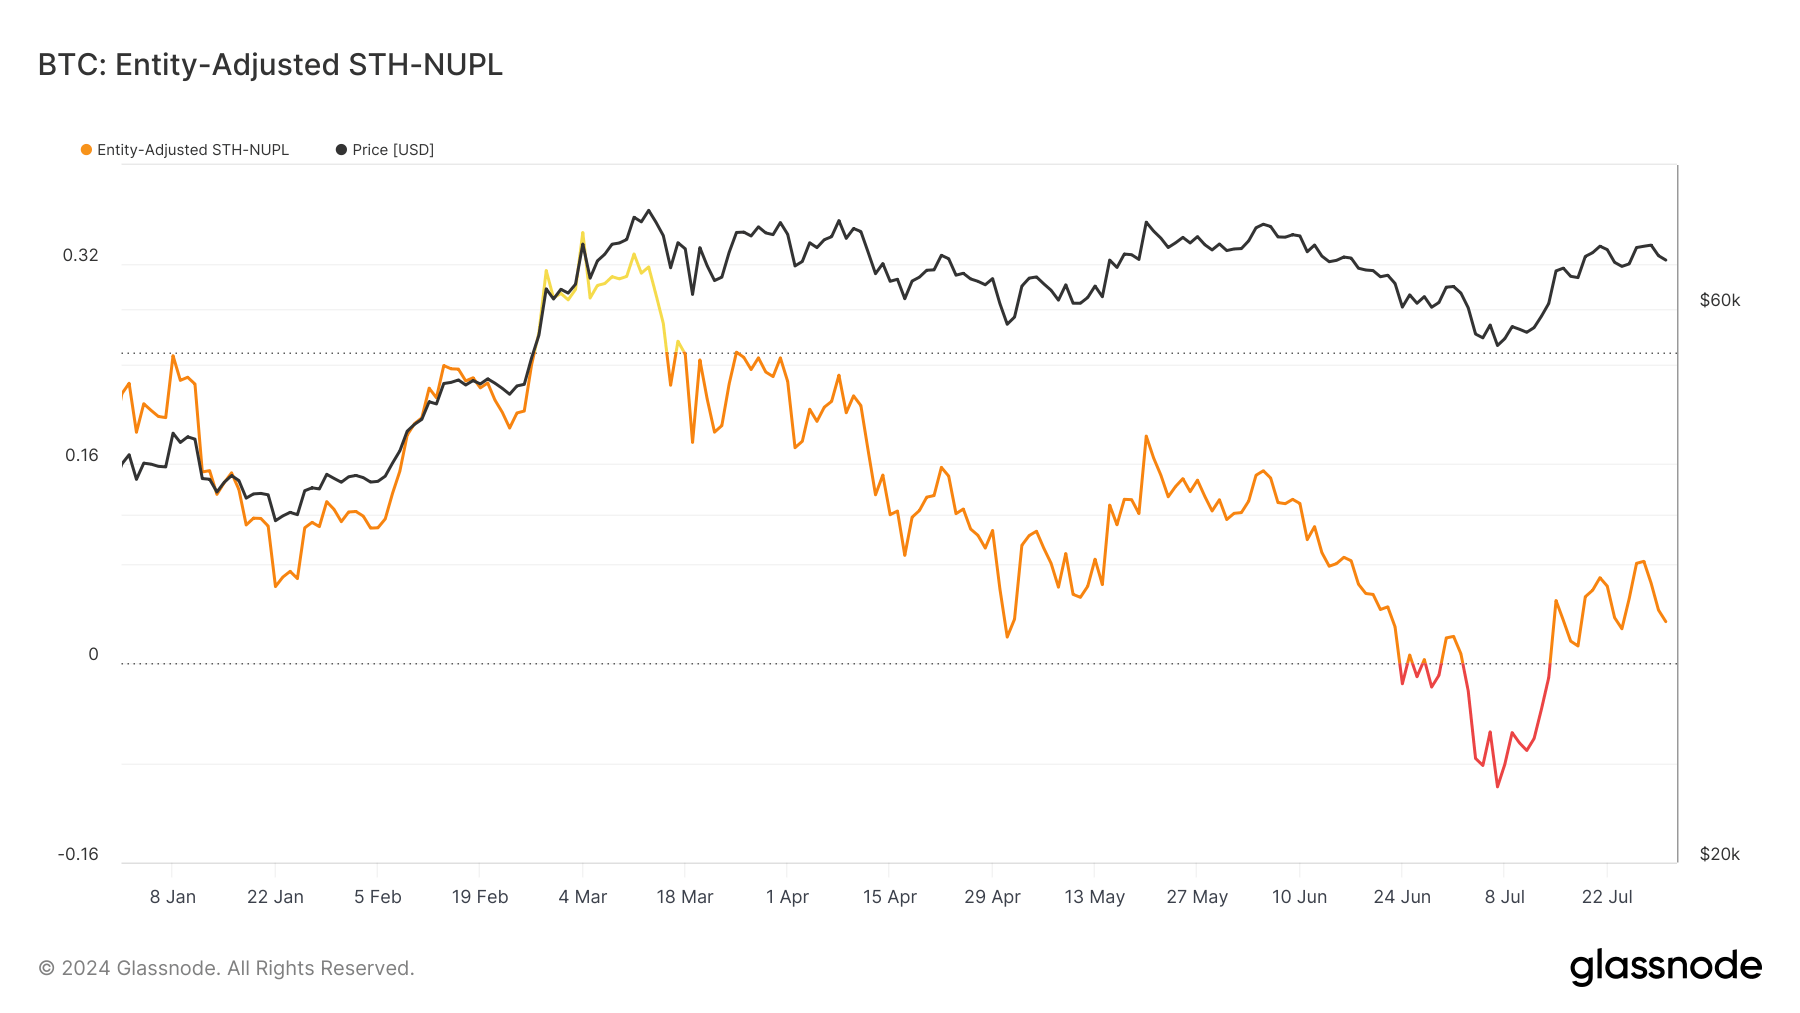
This year, STH-NUPL saw as much volatility as its LTH counterpart. The ratio entered the optimism category above 0.24 in March, only to drop into capitulation territory below 0 in late June and mid-July. This drop reflects the market’s severe correction and the ensuing panic among short-term holders.
Since July 7, STH-NUPL has been trending upwards, breaking above 0 and entering the hope category on July 15. As of July 31, the metric stands at 0.033, a slight decrease from a recent high of 0.081 on July 27. This upward trend indicates a gradual recovery in market sentiment among short-term holders, though it remains cautious and uncertain.
The disparity between LTH-NUPL and STH-NUPL highlights long-term and short-term holders’ contrasting behaviors and sentiments. LTH-NUPL’s higher and more stable values suggest a stronger and more consistent belief in the market’s long-term potential. Having held their assets through various market cycles, long-term holders exhibit greater resilience and confidence, contributing to the metric’s effectiveness in predicting market tops and bottoms.
In contrast, STH-NUPL’s lower values and higher volatility reflect the short-term holders’ sensitivity to market fluctuations. Short-term holders are more likely to react to immediate price movements, leading to frequent shifts between hope, fear, and capitulation phases. This reactive behavior makes STH-NUPL a less reliable indicator of long-term market trends.
LTH-NUPL’s ability to signal market tops is rooted in the behavior of long-term holders during euphoric phases. When LTH-NUPL exceeds 0.7, it indicates that long-term holders are sitting on substantial unrealized profits. Historically, this has led to profit-taking activities, subsequently triggering market corrections or tops.
The post NUPL ratio shows why long-term holders are better market top indicators appeared first on CryptoSlate.


