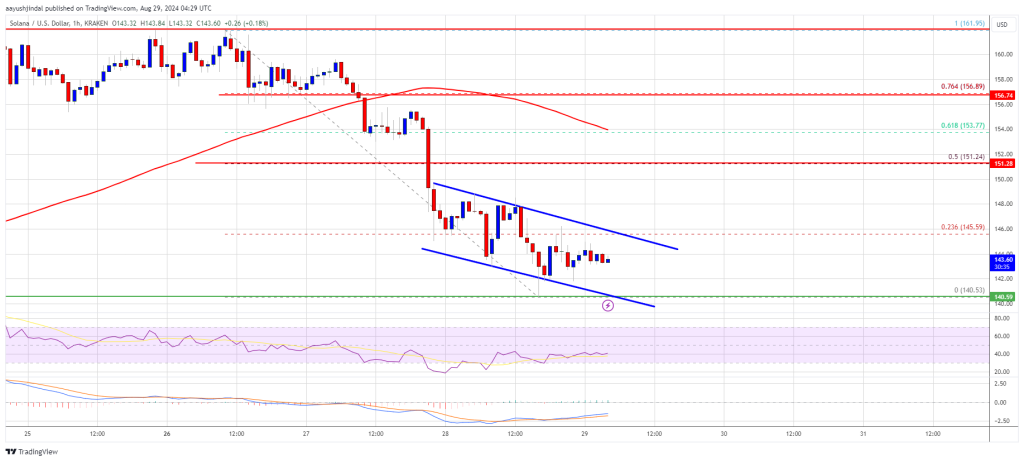
Solana started a fresh decline below $155 and $150. SOL price tested $140 and is currently struggling to start a recovery wave.
- SOL price started a fresh downward move below $150 against the US Dollar.
- The price is now trading below $148 and the 100-hourly simple moving average.
- There is a short-term declining channel forming with resistance at $145.50 on the hourly chart of the SOL/USD pair (data source from Kraken).
- The pair could start a recovery wave if it clears the $148 resistance zone.
Solana Price Revisits $140
Solana price started a fresh decline from well above $155 like Bitcoin and Ethereum. SOL gained pace and traded below the $150 level. It even tested the $140 support level.
A low was formed at $140.53 and the price is now consolidating losses. There was a minor upward move above the $142 and $143 levels. The price climbed above the 23.6% Fib retracement level of the downward move from the $161.95 swing high to the $140.53 low.
Solana is now trading well below $150 and the 100-hourly simple moving average. On the upside, the price is facing resistance near the $146 level. There is also a short-term declining channel forming with resistance at $145.50 on the hourly chart of the SOL/USD pair.
The next major resistance is near the $148 level. A successful close above the $148 and $150 resistance levels could set the pace for another steady increase. The next key resistance is near $152 or the 50% Fib retracement level of the downward move from the $161.95 swing high to the $140.53 low. Any more gains might send the price toward the $162 level.
More Downsides in SOL?
If SOL fails to rise above the $146 resistance, it could start another decline. Initial support on the downside is near the $142 level. The first major support is near the $140 level.
A break below the $140 level might send the price toward $132. If there is a close below the $132 support, the price could decline toward the $125 support in the near term.
Technical Indicators
Hourly MACD – The MACD for SOL/USD is gaining pace in the bearish zone.
Hourly Hours RSI (Relative Strength Index) – The RSI for SOL/USD is below the 50 level.
Major Support Levels – $142 and $140.
Major Resistance Levels – $146 and $148.


