Ethereum price dived below the $2,420 and $2,400 support levels. ETH tested $2,300 and is now showing signs of a decent recovery wave.
- Ethereum is attempting a recovery wave from the $2,300 zone.
- The price is trading below $2,500 and the 100-hourly Simple Moving Average.
- There is a key bearish trend line forming with resistance at $2,440 on the hourly chart of ETH/USD (data feed via Kraken).
- The pair must clear the $2,500 resistance to start a steady increase in the near term.
Ethereum Price Dips Again
Ethereum price extended losses below the $2,420 level. ETH even traded below the $2,400 support before the bulls appeared. A low was formed at $2,308 and the price is now attempting a recovery wave like Bitcoin.
There was a move above the $2,320 and $2,350 resistance levels. The price climbed above the 23.6% Fib retracement level of the downward wave from the $2,564 swing high to the $2,308 low, but there are many hurdles on the upside.
Ethereum price is now trading below $2,500 and the 100-hourly Simple Moving Average. On the upside, the price seems to be facing hurdles near the $2,440 level. It is close to the 50% Fib retracement level of the downward wave from the $2,564 swing high to the $2,308 low.
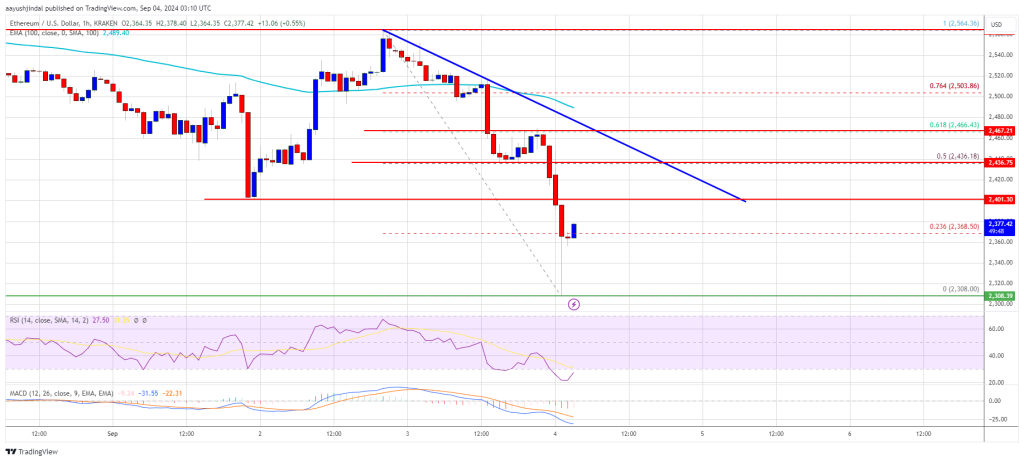
There is also a key bearish trend line forming with resistance at $2,440 on the hourly chart of ETH/USD. The first major resistance is near the $2,500 level. A close above the $2,500 level might send Ether toward the $2,550 resistance. The next key resistance is near $2,650. An upside break above the $2,650 resistance might send the price higher toward the $2,800 resistance zone in the near term.
Another Decline In ETH?
If Ethereum fails to clear the $2,440 resistance, it could start another decline. Initial support on the downside is near $2,320. The first major support sits near the $2,300 zone.
A clear move below the $2,300 support might push the price toward $2,250. Any more losses might send the price toward the $2,120 support level in the near term. The next key support sits at $2,040.
Technical Indicators
Hourly MACD – The MACD for ETH/USD is losing momentum in the bearish zone.
Hourly RSI – The RSI for ETH/USD is now below the 50 zone.
Major Support Level – $2,300
Major Resistance Level – $2,440


