Solana has started another decline, falling below the $137 support level, signaling that bearish momentum is gaining traction. The once-promising uptrend has faltered, leaving traders and investors wondering if more losses are on the horizon. As selling pressure intensifies, the question now is whether Solana can find a new foothold or if the bears will continue to push its price lower.
In this analysis, we’ll provide an in-depth analysis of Solana’s recent breakdown below this key support level, examining the growing bearish momentum and exploring the key levels to watch and what could come next for Solana.
As of the time of writing, Solana was trading at approximately $131, reflecting a 4.67% decline with a market capitalization exceeding $16 billion and a trading volume surpassing $1.6 billion. Over the past 24 hours, SOL’s market cap has dropped by 4.65%, while trading volume has surged by 92.92%.
How Low Can Solana Fall?
On the 4-hour chart, Solana (SOL) has shown a clear shift in momentum toward the bearish side, as it decisively breaks below the critical $137 level along with the 100-day Simple Moving Average (SMA). This breakdown reflects a weakening technical setup, with sellers gaining the upper hand and pushing SOL toward the $118 support zone. Particularly, the breach of the 100-day SMA, a widely-watched indicator of the overall market trend, suggests that negative momentum is not only increasing but may also signal a prolonged downside movement
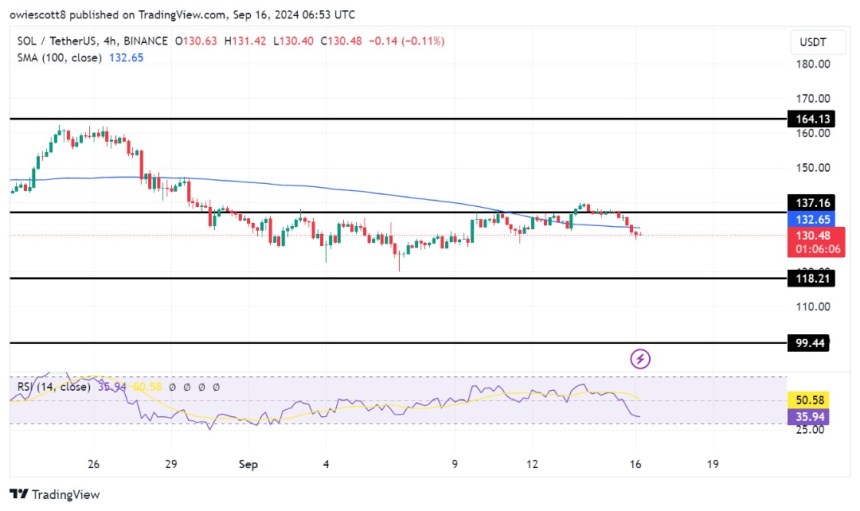
Also, the Relative Strength Index (RSI) on the 4-hour chart has dropped below the 50% threshold, now sitting at 35%. With the RSI attempting to move deeper into the oversold territory, it shows that bears are gaining control, and further downside could be on the horizon if buying interest doesn’t pick up soon.
On the daily chart, Solana is exhibiting substantial pessimistic movement, having slipped below the 100-day Simple Moving Average and forming multiple bearish candlesticks as it moves toward the $118 level. This steady decline underscores strong selling pressure and deteriorating market sentiment, signaling a heightened risk of further losses. The persistent downward momentum indicates that bears are firmly in control, with SOL potentially facing even deeper corrections in the near term.
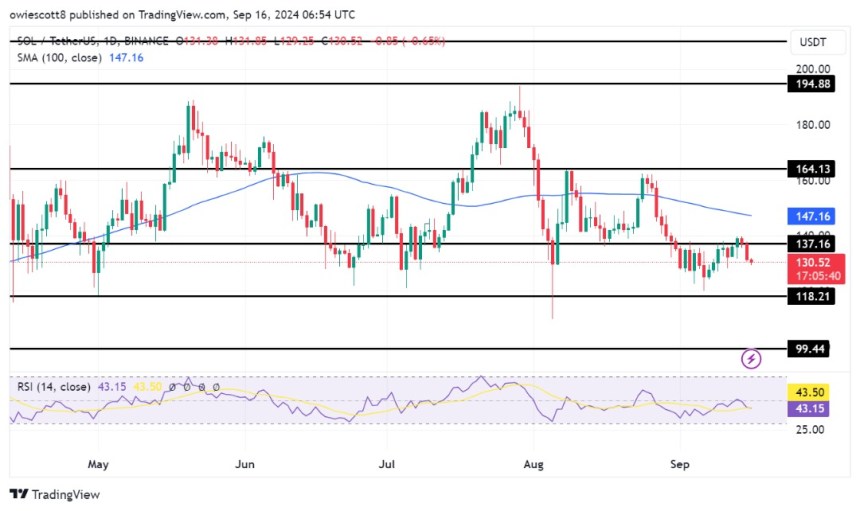
Finally, the 1-day RSI indicates that bearish pressure on SOL is intensifying as the indicator has recently dropped to 43% after failing to rise above the 50% mark, highlighting increased selling pressure and a growing downside signal for the cryptocurrency.
Potential Support Zones To Watch For A Rebound
As SOL navigates its current bearish trend, key support zones to watch include $118, which serves as a significant psychological and technical level where a strong defense could indicate a potential reversal or consolidation. If $118 fails to hold, $99 could provide additional support, acting as a historical pivot point and possible base for recovery.
Should Solana rebound at any of these support levels, the price could start moving upward toward the $137 resistance mark. A successful breakout above this resistance could signal a shift to a bullish trend, potentially leading to further gains as SOL targets higher resistance levels.


