WIF is showing impressive strength as bullish momentum takes control, with the Relative Strength Index (RSI) pointing to even greater upside potential. The current RSI reading suggests that buying pressure remains strong, fueling optimism for continued gains. While bulls hold their ground, they are increasingly confident that WIF could be poised for a significant breakout toward the $2.8 mark.
As market sentiment shifts favorably, this article aims to explore the bullish dominance in WIF, with a focus on how the RSI signals promising upside potential. By analyzing key technical indicators and market trends, the objective is to assess whether WIF can maintain its upward momentum and successfully break through upcoming resistance levels.
Bullish Sentiment Strengthens: Will WIF Break $2.6?
On the 4-hour chart, WIF has displayed robust bullish momentum after successfully breaking above the $2.2 mark. This upward surge has pushed the price closer to the $2.8 resistance level, setting the stage for a potential breakout.
As the bulls continue to assert control, this resistance level becomes a critical hurdle. A decisive move above $2.8 could open the door for further gains, attracting more buying interest and potentially leading to new highs.
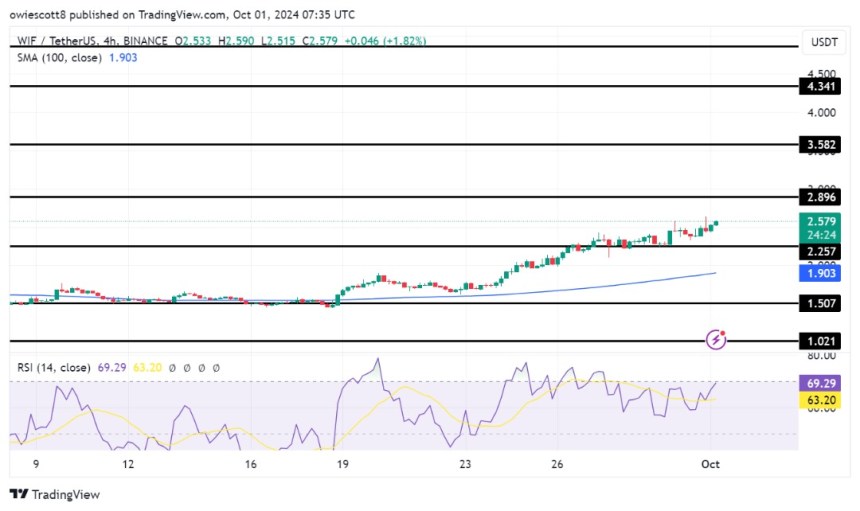
An analysis of the 4-hour Relative Strength Index (RSI) indicates a renewed potential for upward movement, with the RSI climbing back to the 68% level after previously dipping to 62%. If the RSI continues to rise, WIF may push higher, possibly breaking through key resistance levels.
Furthermore, WIF has decisively surpassed the 100-day Simple Moving Average (SMA) and the $2.2 level on the daily chart, marking a notable shift in its price momentum. By holding above these key levels, the asset demonstrates its strength and reinforces a bullish outlook. This optimistic trajectory is not simply a temporary fluctuation. Rather, it reflects robust buying interest and heightened market confidence, suggesting that WIF is ready for additional gains soon.
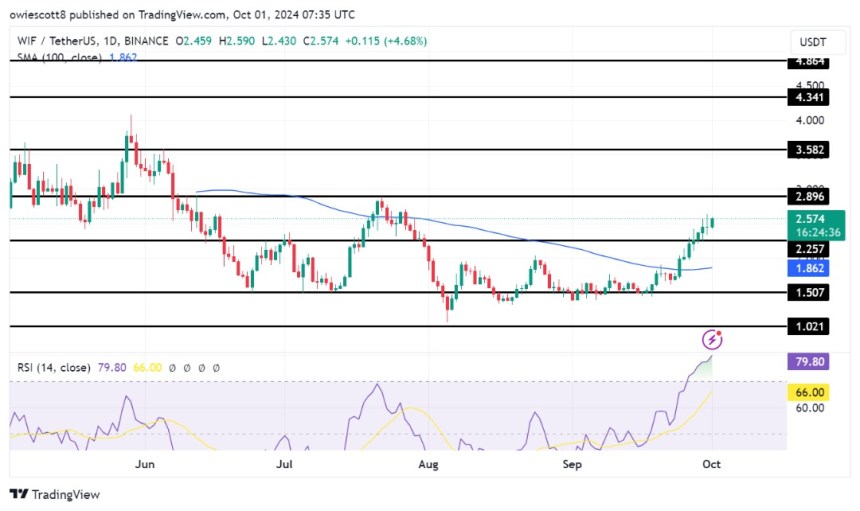
The Relative Strength Index (RSI) on the daily chart is currently at 79%, showing no signs of declining in the near term. An elevated RSI level implies that WIF is in overbought territory, signifying strong buying pressure and heightened market enthusiasm. Although high readings can point to potential exhaustion in upward movement, the absence of immediate signals for a pullback suggests that bullish sentiment is still prevalent.
What To Expect In The Short-Term For The Meme Coin
Presently, WIF is demonstrating strong positive motion, prompting traders and investors to monitor key levels for potential price movements. Maintaining its position above the 100-day Simple Moving Average (SMA) and the $2.2 mark could lead to more gains, with the $2.6 resistance level on the horizon. A successful breakout above $2.6 may unlock additional price growth and enhance traders’ optimism, signaling a more sustained upward trend.
However, with the Relative Strength Index indicating overbought conditions at 79%, a price correction could occur if buying pressure wanes, causing WIF’s price to start dropping toward the $2.2 mark for a retest.


