As SUI dips further into bearish territory, technical indicators are increasingly signaling a challenging path ahead. A key measure, the Relative Strength Index (RSI), has turned negative, suggesting that selling pressure is mounting and that more downside may be on the horizon. With SUI navigating this bearish shift, market participants are keeping a close eye on potential support levels, wondering if the asset can stabilize or if sellers will continue to drive prices lower.
This analysis explores SUI’s recent entry into bearish territory, examining the implications of the RSI’s downward shift and the potential for more price declines. It also seeks to provide insights into the downside risks facing SUI by assessing key technical indicators and support levels, this piece.
Market Overview: SUI’s Shift Into Bearish Territory
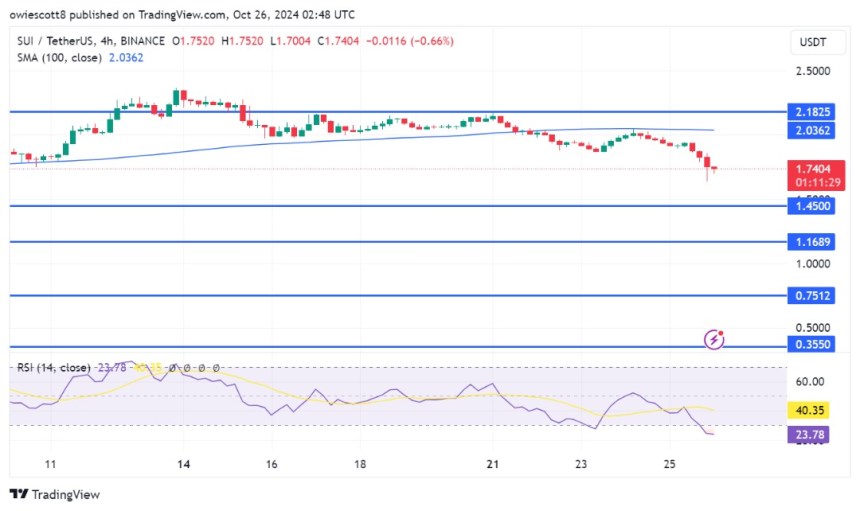
On the 4-hour chart, SUI has shown strong bearish momentum, slipping below the 100-day Simple Moving Average (SMA) as it approaches the $1.4 mark printing multiple bearish candlesticks. The 100-day SMA, typically a significant support level, now acts as resistance, signaling a shift in sentiment where sellers have gained the upper hand.

An analysis of the 4-hour Relative Strength Index (RSI) reveals that the indicator has now dropped to a low 23% level after a previous recovery attempt failed to hold at 52%. With the RSI now in the oversold zone, selling activity may be overextended, unless a significant influx of buying interest appears, SUI could remain under pressure, potentially leading to additional drops.
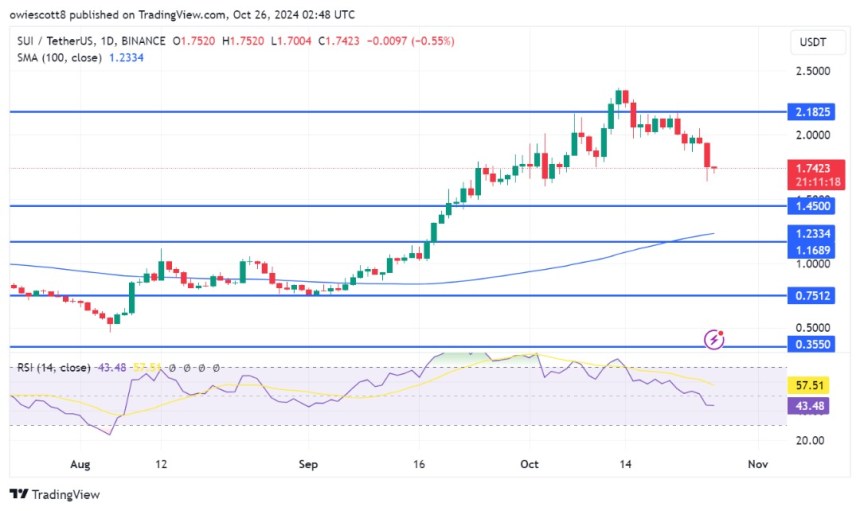
Also, on the daily chart, SUI is exhibiting a clear pessimistic path as it trends downward toward the $1.4 mark and approaches the 100-day SMA. The $1.4 level, alongside the 100-day SMA, acts as a crucial support area, and a break below these points could reinforce the current downtrend, potentially opening the door to further declines.

Lastly, the daily RSI for SUI has dropped to 42%, significantly falling below the critical 50% threshold, which usually separates bullish from bearish territory. Typically, this decline highlights the strong bearish momentum, indicating that sellers are firmly in control and reflecting increasing pessimism about SUI’s price.
Potential Price Targets: How Low Could SUI Go?
As SUI continues its negative movement, traders need to pinpoint potential price targets. If the $1.4 support level is breached, SUI could fall to $1.23, where buying interest may resurface. An extended drop below this level could trigger a deeper correction toward other support levels.
Conversely, should the cryptocurrency manage to hold its position above $1.4, it could indicate a potential reversal, enabling bulls to reclaim some control in the market thereby driving the price higher toward the $2.1 resistance level and beyond.


