On-chain data shows the Bitcoin long-term holders have started a phase of distribution recently. Here’s what this could mean for BTC’s price.
Bitcoin Long-Term Holders Have Just Sold Over 177,000 Tokens
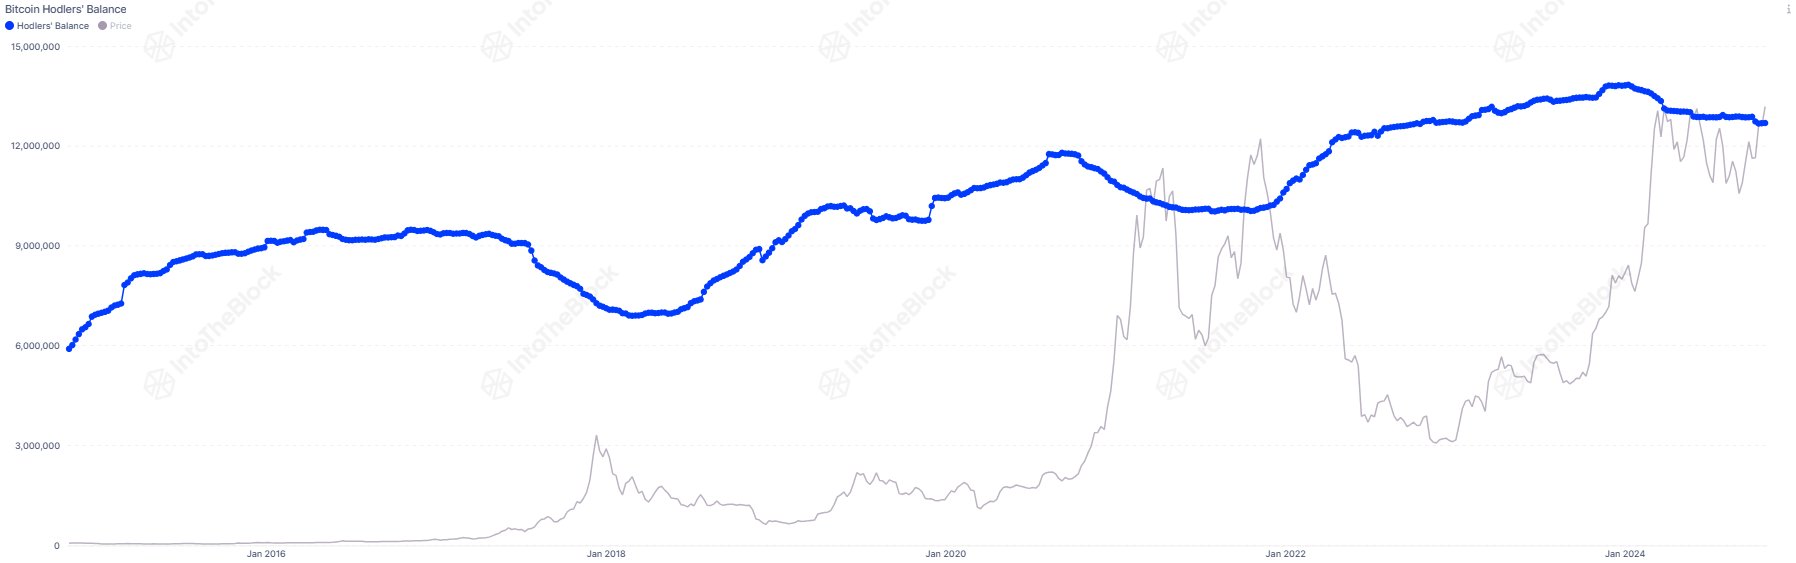
As pointed out by CryptoQuant community analyst Maartunn in a new post on X, old coins have seen a negative balance change recently. Below is the chart from the market intelligence platform IntoTheBlock cited by the analyst, which shows the balance changes for different holder groups on the Bitcoin network.

The groups here have been divided based on holding time: investors who bought their coins within the past month fall inside the <1 Month cohort (colored in yellow), while those who bought between one and twelve months ago are put into the 1-12 Months group (pink).
In the context of the current topic, neither of these is of focus; the relevant cohort is the third one (blue), which contains the investors who have been holding for more than twelve months.
Statistically, the longer an investor holds onto their coins, the less likely they become to sell said coins at any point. Thus, the 12+ Months cohort would include the most resolute of the hands on the network.
From the chart, it’s apparent that these HODLers had been busy accumulating during the 2022 bear market and the 2023 recovery rally, but the trend has seen a shift in 2024.
During the first quarter of the year, the balance change of this Bitcoin cohort turned significantly red, implying that the long-term holders were taking the gains of their patience.
These diamond hands eventually saw their selling pressure dry up as the cryptocurrency’s consolidation following its new all-time high (ATH) stretched on until finally, their balance change hit completely neutral levels.
Recently, as bullish waves have returned for Bitcoin, the balance change for the group has turned red again, implying these HODLers have started selling once more.
As for what this could mean for the cryptocurrency, perhaps historical pattern could shed some light. “Long-Term Holder activity often acts as a contrarian indicator,” says Maartunn. “LTHs tend to buy (increase holdings) during price dips and sell (reduce holdings) during price surges.”
It’s visible from the chart, however, that while the LTHs do time their selling with bull runs, the actual top of the cryptocurrency doesn’t occur until their distribution has gone on for a lengthy period. This could potentially imply available room for BTC to go in the current rally, before a ceiling is hit.
Something that may invalidate the pattern, though, is the fact that the scale of selling from the LTHs has been less intense this cycle, as IntoTheBlock has pointed out in an X post.
“While long-term holders are selling, it’s less aggressive than in past bull peaks,” notes the analytics firm. Thus, it’s possible that the current Bitcoin cycle is establishing a new dynamic in the market.
BTC Price
At the time of writing, Bitcoin is trading around $68,800, down more than 3% over the past week.


