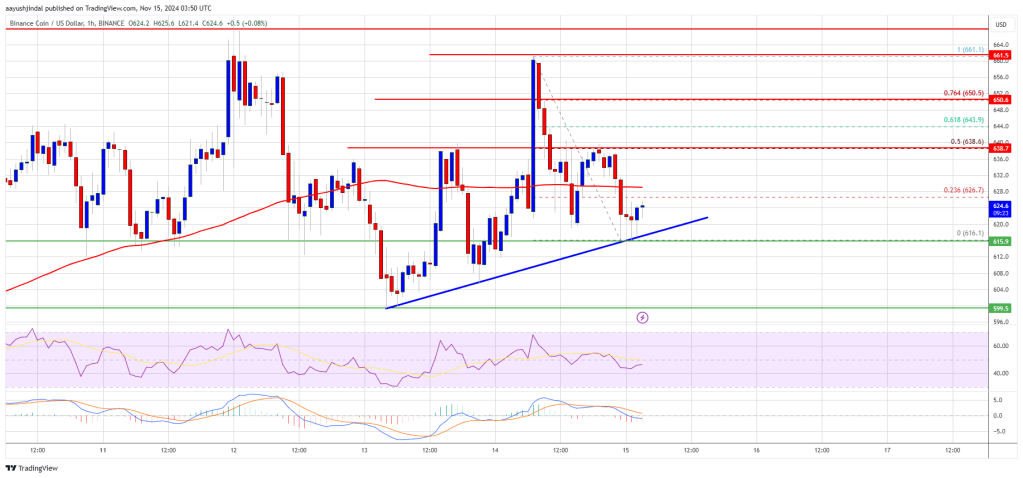
BNB price struggled to clear the $665 resistance zone. The price is consolidating and might aim for a fresh increase above the $635 level.
- BNB price started a downside correction from the $665 resistance zone.
- The price is now trading below $640 and the 100-hourly simple moving average.
- There is a connecting bullish trend line forming with support at $620 on the hourly chart of the BNB/USD pair (data source from Binance).
- The pair must stay above the $600 level to start another increase in the near term.
BNB Price Holds Support
After a close above the $620 level, BNB price extended its increase. However, upsides were limited above $660 and the price remained capped, unlike Ethereum and Bitcoin.
There was a move below the $632 and $620 levels. However, the price is now holding gains above the $600 level. A low was formed at $616 and the price is now consolidating near the 23.6% Fib retracement level of the downward move from the $661 swing high to the $616 low.
The price is now trading below $620 and the 100-hourly simple moving average. There is also a connecting bullish trend line forming with support at $620 on the hourly chart of the BNB/USD pair.
If there is a fresh increase, the price could face resistance near the $626 level. The next resistance sits near the $638 level or the 50% Fib retracement level of the downward move from the $661 swing high to the $616 low. A clear move above the $638 zone could send the price higher.
In the stated case, BNB price could test $650. A close above the $650 resistance might set the pace for a larger move toward the $665 resistance. Any more gains might call for a test of the $680 level in the near term.
More Losses?
If BNB fails to clear the $638 resistance, it could start another decline. Initial support on the downside is near the $620 level and the trend line. The next major support is near the $615 level.
The main support sits at $600. If there is a downside break below the $600 support, the price could drop toward the $585 support. Any more losses could initiate a larger decline toward the $565 level.
Technical Indicators
Hourly MACD – The MACD for BNB/USD is losing pace in the bullish zone.
Hourly RSI (Relative Strength Index) – The RSI for BNB/USD is currently below the 50 level.
Major Support Levels – $620 and $615.
Major Resistance Levels – $638 and $650.


