Menu

Categories:

Hot right now:

Follow on:

Coinsurges provides coverage of fintech, blockchain, and Bitcoin, delivering the most recent news and analyses on the future of money. Stay up-to-date with live prices, charts, and trading options for the top exchanges. Keep track of the day's top cryptocurrency gainers and losers, as well as which coins have experienced gains and losses in the past 24 hours.
Trust Coinsurges as your go-to source for all news and updates in the industry.

With a $1 Breakout, Can Fantom (FTM) Price Reach $1.66? 

Share This Post

With a $1 Breakout, Can Fantom (FTM) Price Reach $1.66?

The post With a $1 Breakout, Can Fantom (FTM) Price Reach $1.66?  appeared first on Coinpedia Fintech News

Despite the sudden increase in volatility in the crypto market, as Bitcoin struggles to eclipse the $100,000 barrier, the altcoins are sustaining a bullish trend. The FTM price has increased nearly 35% over the past 7 days and has reached a market cap of $2.7 billion. 

Currently, the Fantom price is heading to reclaim the $1 psychological mark as the underlying bullish sentiments are on the rise. Will this $1 breakout result in a parabolic price surge in the FTM price trend? Let’s find out in Coinpedia’s latest Fantom price analysis. 

Fantom Price Performance

In the daily chart, the FTM price action showcases a streak of four consecutive bullish candles. The streak started from the 100-day EMA near the $0.64 mark and peaked at the $1 psychological mark. This accounts for a 56.49% price surge in just four days. 

Fantom Price Performance

TradingView

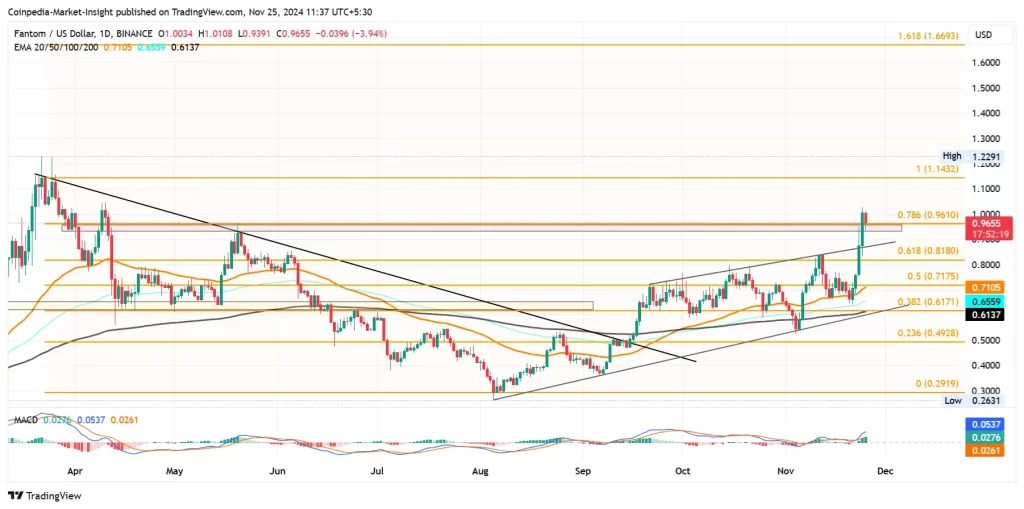
However, the intraday pullback of 3.90% reveals the massive overhead supply absorbing the demand surge. The FTM price analysis showcases a resistance trendline breakout surpassing the 78.60% Fibonacci level at $0.9610. 

The intraday pullback comes as a potential retest of the breakout rally, increasing the post-retest reversal bull run chances. With the resistance trendline breakout, the FTM price trend has outgrown the rising channel pattern and is likely to reach the $1.14 neckline. 

This will complete the rounding bottom reversal and increase the chances of a new 52-week high. 

Technical Indicators:

EMA: Supporting the bullish chances, the 50-day, 100-day, and 200-day EMA are in a positive alignment. 

MACD: The MACD indicator showcases the average line skyrocketing with the surge of bullish histograms. Hence, the technical indicators are maintaining a buy signal for Fantom. 

Will FTM Price Hit $1.66?

Currently, the 52-week high stands at $1.2291, revealing an upside chance of nearly 30%. The Fibonacci levels paint an optimistic target at $1.3748, followed by the $1.66 resistance level. 

If the FTM price fails to sustain above the $0.96 mark, the downfall could retest the broken resistance trendline near the $0.85 level.

Will the FTM price rally result in a jump to the $2 mark? Find out now in Coinpedia’s latest Fantom price prediction.

FAQs

What is the recent performance of FTM?

FTM has surged nearly 35% in the past 7 days, with a 56.49% increase in just four days, reaching the $1 psychological mark.

What is the next key target for FTM?

If the $1 breakout holds, FTM is likely to reach $1.14, completing a rounding bottom reversal, and possibly a new 52-week high at $1.2291.

What are the downside risks for FTM?

A failure to sustain above $0.96 could lead to a retest of the broken resistance trendline near $0.85.

Read Entire Article
spot_img
- Advertisement -spot_img

Related Posts

JPMorgan and Polymarket Align on Rising 2025 Recession Probability

After two consecutive days of steep declines on Wall Street, forecasts of a looming recession have grown even more prevalent—intensifying even more so since the moment US President Donald Trump

Dogecoin Faces Make-Or-Break Support Level – Will DOGE Hold?

Dogecoin is now trading at critical levels after enduring several days of sustained selling pressure and failing to break above the $018 mark The popular meme coin is currently down 65% from its

US SEC Takes A Stand: ‘Covered’ Stablecoins Are Not Securities

The United States Securities and Exchange Commission has clarified its stance on dollar-backed stable cryptocurrencies, stating that “covered” stablecoins are not securities This move represents

Memecoins broke crypto—now they might fix it

The following is a guest post and opinion of Shibtoshi, Founder of SquidGrow Memecoins have created unprecedented chaos within the crypto industry Most analysts see the chaos as a binary — some

Will Bitcoin Crash Again? Bearish Pattern Spotted

The post Will Bitcoin Crash Again Bearish Pattern Spotted appeared first on Coinpedia Fintech News Amid the ongoing tariff war, Bitcoin (BTC), the world’s largest cryptocurrency by market cap, is

Bitcoin Price Watch: Bulls Eye $85.5K Breakout as Bears Hold the Line

Bitcoin is trading at $82,560 to $82,944 over the last hour with a market capitalization of $164 trillion and a 24-hour trading volume of $2498 billion Within the last 24 hours, bitcoin fluctuated