The post Notcoin Surges 10%, Targets $0.010 Psychological Mark appeared first on Coinpedia Fintech News
With the surge of buying pressure in the crypto market, Notcoin is making a bullish comeback. Inching closer to its psychological mark of $0.010, the overnight surge of more than 10% has driven its market cap to $998 million.
As the trading volume surges to $401 million, the Notcoin is soon to become a billion-dollar altcoin. Will this extend the ongoing rally to a new all-time high? Let’s find out.
Notcoin Price Analysis
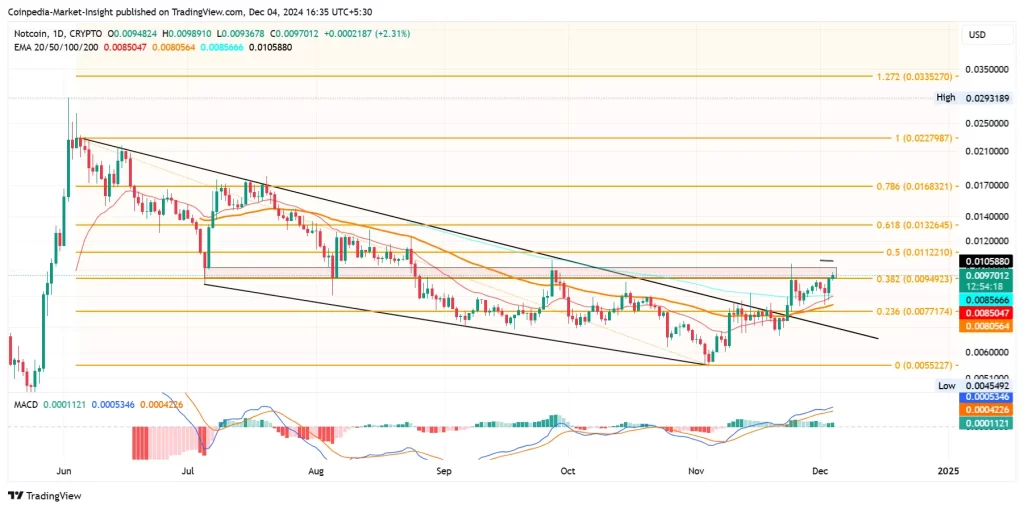
In the daily chart, the Notcoin price action shows a recovery rally surpassing a long-coming resistance trend line. This marks a falling channel breakout rally with a burst in trend momentum.

The breakout rally had struggled to surpass the 38.20% trend level at $0.0094. However, with the double bottom formation and the 100-day EMA line acting as the base, NOT token price has surpassed the crucial resistance.
The overhead supply zone extends from $0.0097 to the psychological mark of $0.010. Currently, Notcoin is trading at $0.009743, following last night’s 9% jump.
Over the past 24 hours, it has increased by more than 10% and is heading to reclaim the psychological mark. With the bullish turnaround and the neckline breakout, the immediate resistance for Notcoin is at $0.011, or the 50% Fibonacci level.
Notcoin Technicals and Price Targets
The bullish trend in the MACD and Signal lines has avoided a bearish crossover twice, revealing strong underlying bullishness. Furthermore, the 20-day EMA line is giving a bullish crossover with the 100-day EMA line, reflecting a short-term surge in underlying bullishness.
A bull run beyond this point will mark a change in the trend character of Notcoin, bringing $0.016 and $0.022 as the next potential price targets. Hence, the altcoin shows a potential upside of more than 130% in the coming month.
On the other hand, crucial support remains the 50-day EMA line at $0.0080 and the 100-day EMA line at $0.0085.
Read More: Notcoin Price Prediction 2024, 2025-2030.
FAQs
Notcoin’s recovery rally is fueled by a falling channel breakout, double-bottom formation, and bullish EMA crossovers, signaling strong buying pressure.
Resistance lies at $0.0097 to $0.010, with key targets at $0.011 (50% Fibonacci), $0.016, and $0.022. Support is at the 50-day EMA ($0.0080) and 100-day EMA ($0.0085).
With bullish indicators and a breakout rally, Notcoin shows a potential upside of more than 130%, targeting $0.016 and $0.022.


