Ethereum’s price action is showing signs of an impending breakout as it moves back and forth within a falling wedge pattern on the daily candlestick time frame chart. According to an analysis first posted on the TradingView platform, this formation is a strong bullish signal that could push the Ethereum price toward $3,800 if history repeats itself.
The falling wedge, which is generally known to be a bullish price action structure, is developing between the 50-day and 200-day moving averages for Ethereum, in line with a similar pattern from that preceded an Ethereum price rally last year.
Ethereum Repeating Falling Wedge Pattern
Ethereum has largely underperformed this cycle without any clear breakout yet. Furthermore, the cryptocurrency has yet to recover towards its 2021 all-time high unlike many of its other crypto counterparts with large market caps.
Technical analysis of the current Ethereum price action shows that the leading altcoin has been trading in a decline since the beginning of the year. This decline has been characterized by the formation of lower highs and lower lows, which is quite like a falling wedge pattern. What’s very interesting is that this wedge pattern on the Ethereum price chart is developing between the 50-day and 200-day moving averages, which makes it even more peculiar.
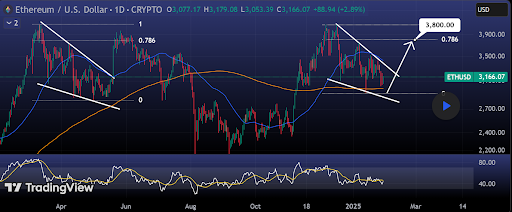
The TradingView analyst highlighted that the current falling wedge price structure mirrors the March 2024 pattern, which saw Ethereum forming a triple bottom before breaking out and reaching the 0.786 Fibonacci extension level. If the same scenario unfolds, the current falling wedge could serve as a launchpad for a price surge towards a target at the $3,800 level. This represents a potential 20% upside from Ethereum’s current trading range.
Resistance Levels Could Delay the Rally
At the time of writing, Ethereum is trading at $3,180, up 1% in the past 24 hours. This marks a steady climb from the lower end of the wedge pattern, bringing the cryptocurrency closer to breaking above the upper trendline around $3,250.
While the technical setup leans bullish after the predicted breakout, it is important to note that Ethereum faces a significant resistance hurdle between $3,400 and $3,500. Sellers positioned at this resistance zone have acted as a strong barrier in recent months, and they have successfully stalled previous attempts by the bulls to push higher.
If Ethereum fails to break through the upper end of this range, another temporary rejection could occur before any sustained move toward $3,800.
If Ethereum successfully clears the $3,500 resistance, it could pave the way for a more extended bullish trend, with $3,800 as the next logical target. Notably, this $3,800 target reflects a tempered outlook on Ethereum compared to past market expectations, a sentiment shaped by its recent price action. However, if strong bullish momentum builds toward $3,800, it could trigger an even larger push toward the $4,000 mark.


