Renowned technical analyst Peter Brandt stirred up the XRP community on January 30 by posting a daily price chart (XRP/USDT) suggesting a “bull flag” continuation pattern. Brandt, whose reputation in charting spans decades, highlighted $4.39541 as the upper price objective based on the current market structure.
“Hey XRP_pill_poppers. To be clear: I could care less what XRP is going to do. If it goes up I want to be long. If it goes down I’ve never shorted it, but prefer to troll the poppers. No other way right now to define the chart other than a bull flag. Of course this could change,” Brandt remarked.
XRP Bull Flag Formation
From the analyst’s vantage point, XRP rallied sharply earlier in January, pushing above $2.6040 before topping near $3.2140. Once this peak formed, the market entered a brief pullback, creating a series of lower highs and lower lows—visualized by descending trendlines on Brandt’s chart. This consolidation resembles a textbook bull flag, a pattern typically interpreted as a pause in an ongoing uptrend.
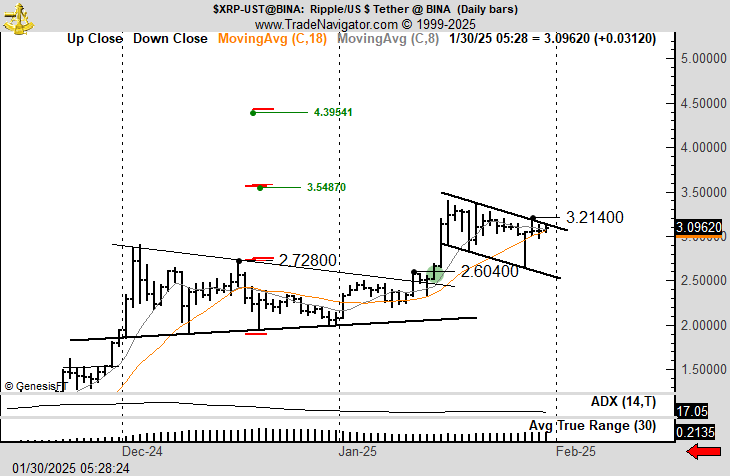
Brandt’s projected breakout could target the next prominent overhead region near $3.5487, with his ultimate bullish objective in the vicinity of $4.39541. These levels—shown by green lines on the chart—indicate possible resistance areas if XRP extends its rally upon confirming the flag’s upper boundary.
Two moving averages are visible on Brandt’s chart: The 8-day moving average (green line) is currently hovering just above $3.00. It is helping to define short-term support levels. The 18-day moving average (orange line) is sloping upwards from below $2.70 and reinforces the broader uptrend in play.
Meanwhile, the ADX reading of 17.05 suggests that the overall trend strength is moderate, leaving room for greater momentum if price breaks decisively from the flag. A 30-day Average True Range (ATR) value near 0.2135 underscores the daily volatility, which has risen compared to earlier phases but remains contained relative to some high-beta alternative coins.
Brandt’s post sparked discussion among traders, including HTL-NL (@htltimor), who noted bullish confirmations using Wyckoff analysis. “Using Wyckoff, it looks good too. Of course, if $TC takes a dive, everything suffers, but it’s one of the better looking alt charts atm,” he stated. Brandt replied with approval, stating “Good confirmation from a good source.”
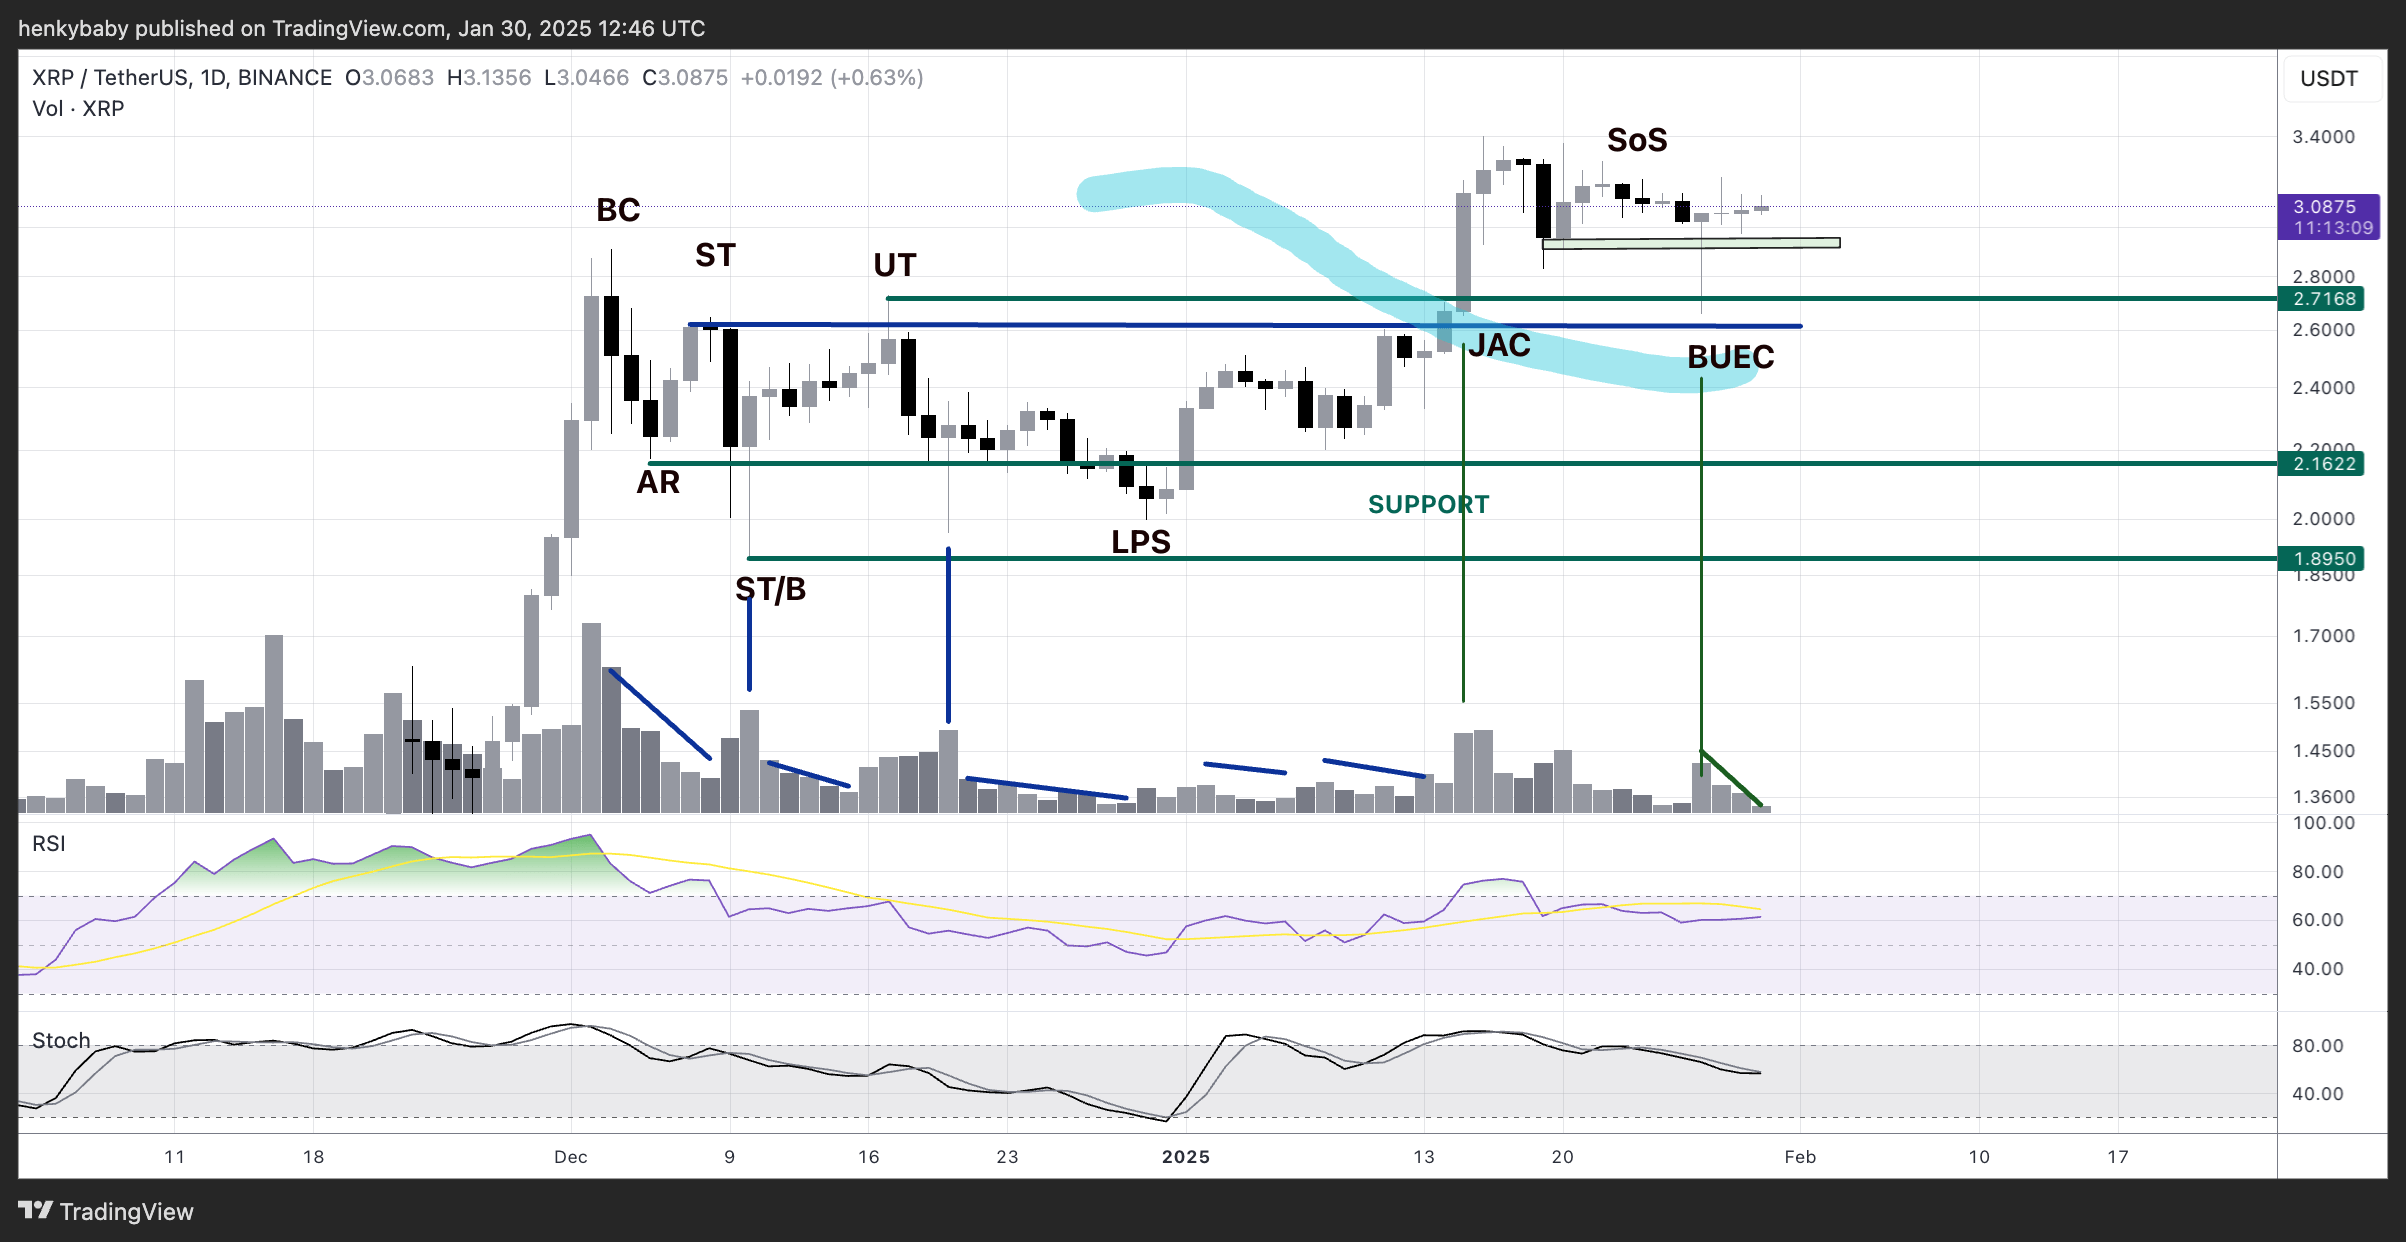
According to the Wyckoff-based chart shared by HTL-NL, XRP has been tracing a series of classic phases—Beginning with the Automatic Rally (AR) after a Selling Climax (SC), followed by multiple Secondary Tests (ST), and culminating in what appears to be a Sign of Strength (SoS). The SoS label often marks the point at which demand decisively overcomes supply, with price pushing above a key resistance level and maintaining support above previously tested zones. This behavior is further supported by volume signatures that show interest resurging during rallies and diminishing on pullbacks.
In Wyckoff terms, a successful SoS within a re-accumulation structure typically paves the way for continued upside. The blue line labeled “BUEC” (Back Up to Edge of the Creek) suggests XRP has already retested its last major resistance as support. Should it hold these levels and confirm the SoS, Wyckoff analysts would anticipate a drive toward higher targets, aligning with Brandt’s bullish flag projection.
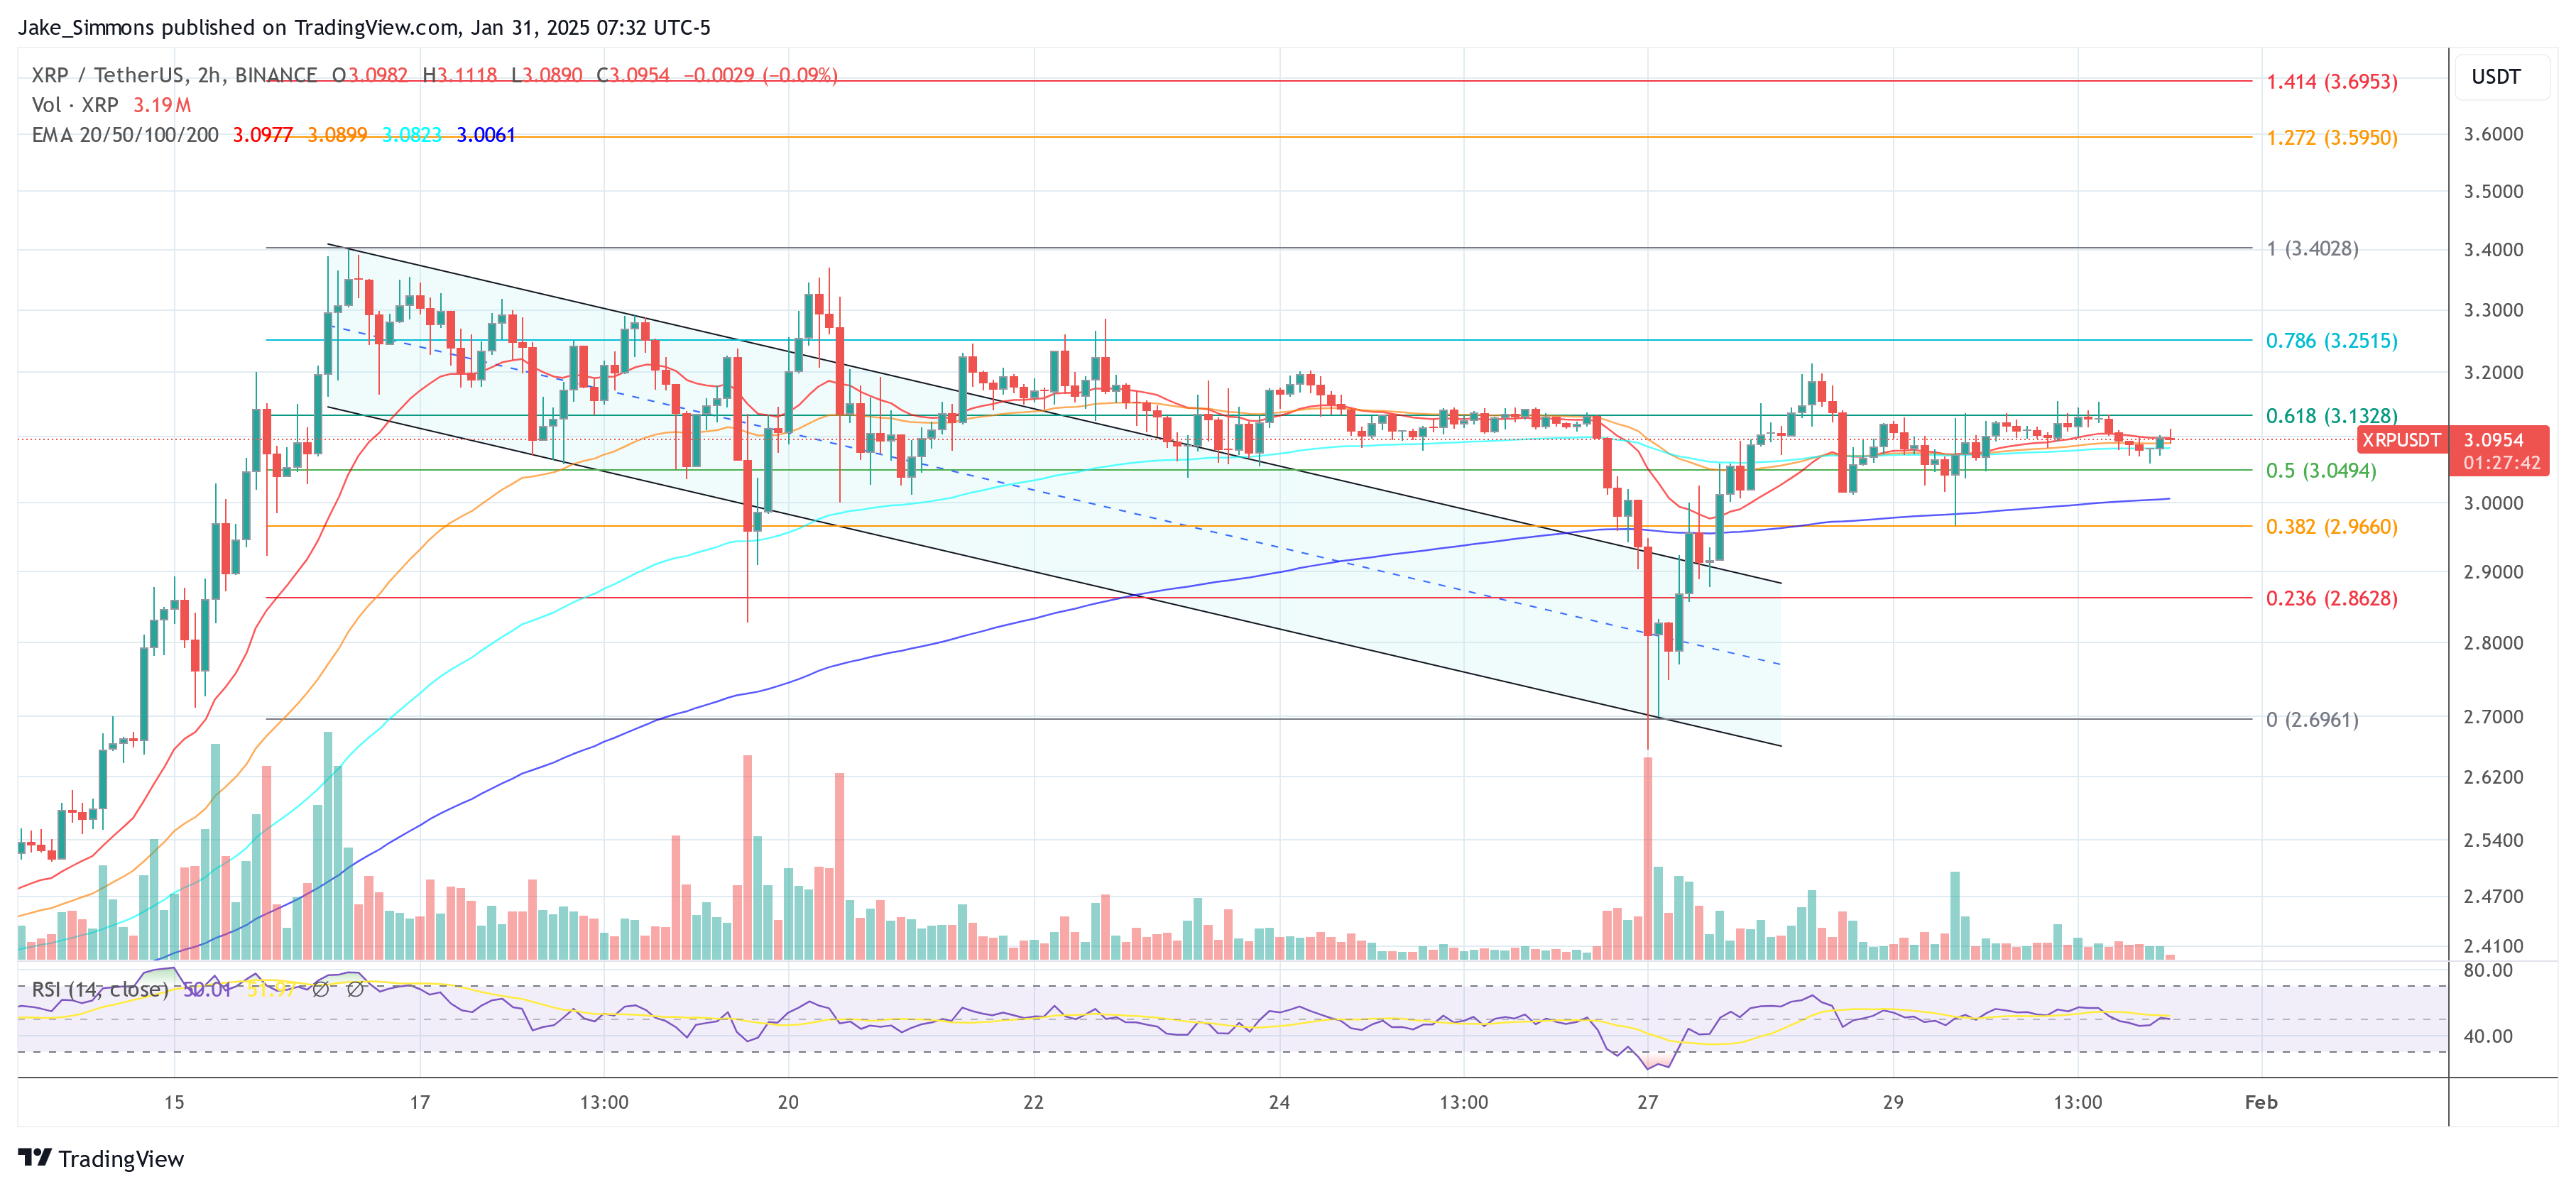
At press time, XRP traded at $3.09.