Meme coin PEPE is showing signs of bullishness in a market currently filled with uncertainty. This bullish sign is reflected through PEPE’s projected breakout of the 800 EMA, which is a sign of bullish reversal.
This bullish case for PEPE was first noted by a crypto analyst known pseudonymously as Slick on social media platform X. The 800 EMA, which has served as a significant resistance level for PEPE price uptrends, is now being tested again after a prolonged period below it.
PEPE Eyes 800 EMA Breakout After Weeks Of Rejection
PEPE is showing signs of a potential bullish reversal, with the price moving toward a critical technical level that could redefine its short-term trajectory. This critical technical level is highlighted through technical analysis of the 800 EMA indicator.
Since January 19, PEPE has consistently traded below the 800 EMA, a trend that has kept the price subdued despite several attempts to break higher. However, recent price action suggests that this prolonged bearish structure may be coming to an end.
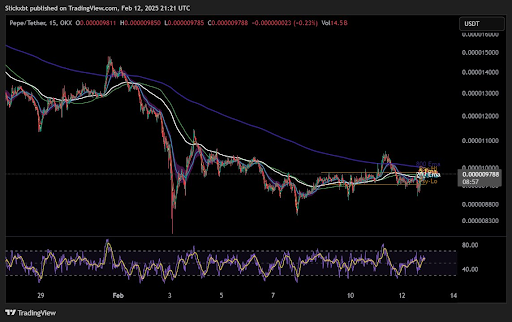
The moving averages are converging more than the previous attempts. The current setup shows a stronger alignment between the short and long-term EMAs, which indicates weakening resistance and increases the probability of an upward breakout. However, this attempt to break above the 800 EMA is most convincing on the 15-minute candlestick timeframe and is yet to be evident on larger timeframes.
Will This Snowball Into A Larger Timeframe Reversal?
The question is whether PEPE’s breakout attempt above the 800 EMA on the 15-minute chart will spark a broader shift in momentum across higher timeframes. Short-term breakouts like this serve as the primer for larger trend reversals, particularly when aligned with technical indicators such as the Exponential Moving Averages (EMAs).
A successful breakout here could bring higher timeframe levels into play, which would mean a longer-term bullish momentum. However, there’s still a risk of a PEPE price rejection at the 800 EMA, even on the 15-minute candlestick timeframe. As shown in the price chart above, this rejection has already happened twice this month, once at the start of January and again on January 11.
However, the current test is more peculiar because other EMAs, including the 200 EMA, have now converged more closely than during the previous failed breakouts. This alignment suggests that resistance may be weakening and increases the likelihood of a decisive move higher.
At the time of writing, PEPE is trading at $0.000009829, up by 3.13% in the past 24 hours. The increase in the past 24 hours is a positive signal for PEPE’s breakout from the 15-minute 800 EMA to larger timeframes.
However, there is still work to do, as PEPE is currently down by 3.85% in a seven-day timeframe. There is also a notable resistance at $0.00001019 that could delay any further uptrend move.


