The post Bitcoin Rebounds: Have the Bulls Taken Over the Rally or More Bearish Action is On the Horizon for the BTC Price Rally appeared first on Coinpedia Fintech News
The market sentiment has dropped to 20 for the first time in recent memory, indicating fear. Besides, the ETFs witnessed a major outflow of over $1 billion, with Blackrock recording over $418 million or 4,200 BTC—the single-largest outflow. This dragged the Bitcoin price close to $82,000, which attracted massive buying interest. Currently, the bulls have triggered a strong rebound and elevated the levels above $86,000. However, the question arises whether the current flip could remain for long or a bull trap is in the making.
The BTC price experienced one of the steepest three-day drops since November 2022, wiping out more than $300 billion from the market. Despite this, some of the proponents remain bullish on Bitcoin, as they claim the revival of the bull run could be triggered once the price enters the demand zone. However, from a broader perspective, the token remains under the bearish influence, and thus the current rebound can be viewed as a short-term relief.
Weekly RSI Raises Concern
The RSI is considered one of the important indicators, which helps to determine the next course of action of the rally. It is used to identify the buy and sell points and also a horizontal consolidation. In the longer perspective, the indicator has remained bearish while the price continued to range high. Previously, when the RSI and the price displayed an inverse co-relation, it led to the beginning of a bear market.
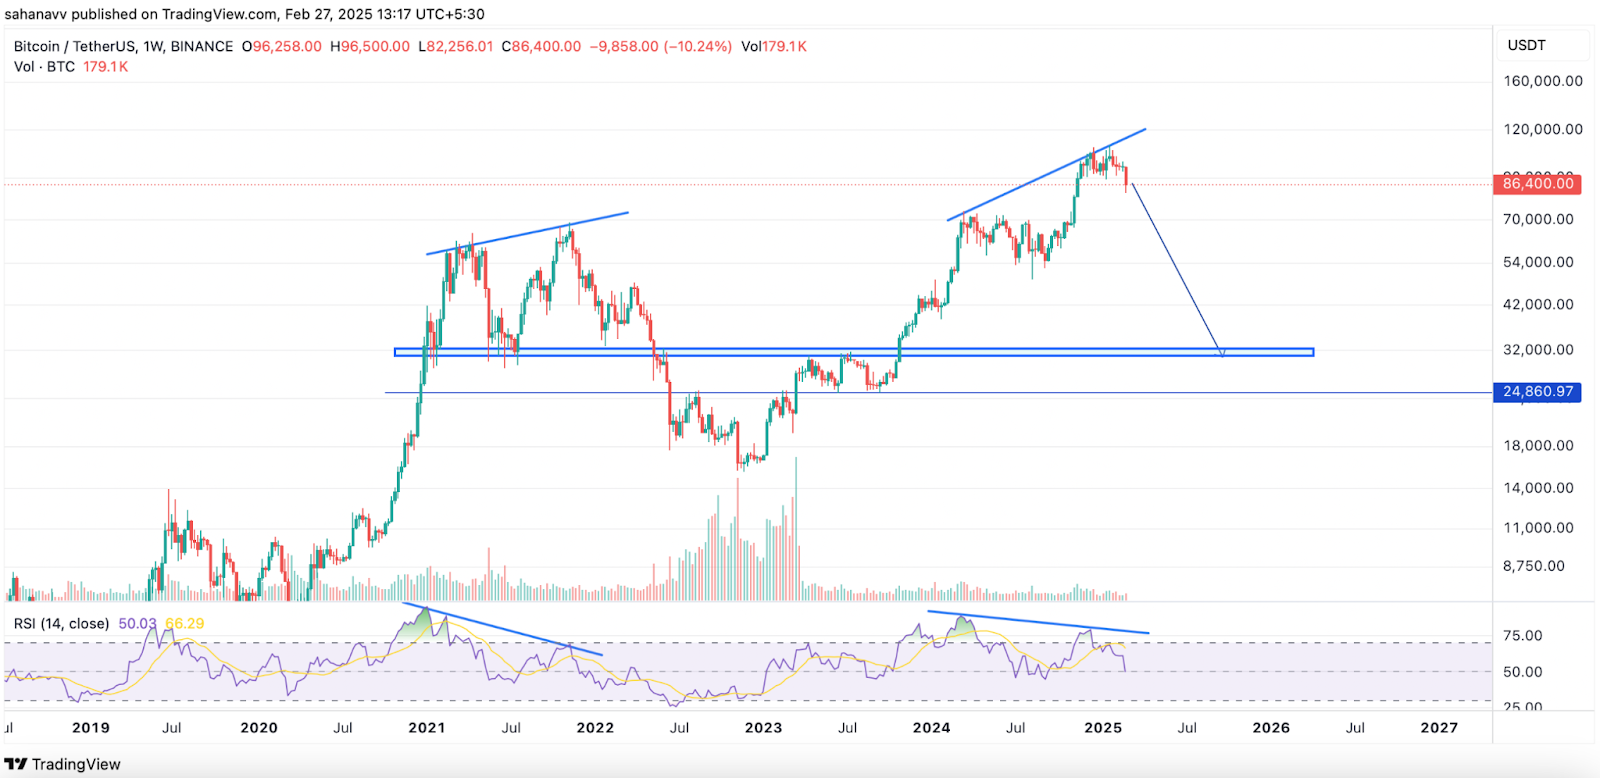
As seen in the above chart, the weekly RSI has been forming lower highs and lows in the times when the price formed higher highs and lows. Back in 2021, a similar pattern occurred, which caused the BTC price to plunge from highs close to $69,000 to the bottom below $16,000. Although the bulls tried hard to validate a rebound, the bears had held a strong grip on the rally that kept on pushing the price lower. Therefore, if the BTC price fails to rise and secure levels above $100K, a similar pattern could follow, dragging the levels by 50%.
More Bearish Action Upcoming For BTC Price
In times when the Bitcoin price is experiencing massive selling pressure, every rebound is looked at as the start of a recovery phase. However, the past trade pattern suggests that the price is yet to enter the demand zone. The realized price and the profit/loss margin suggest the token is expected to witness more bearish heat.
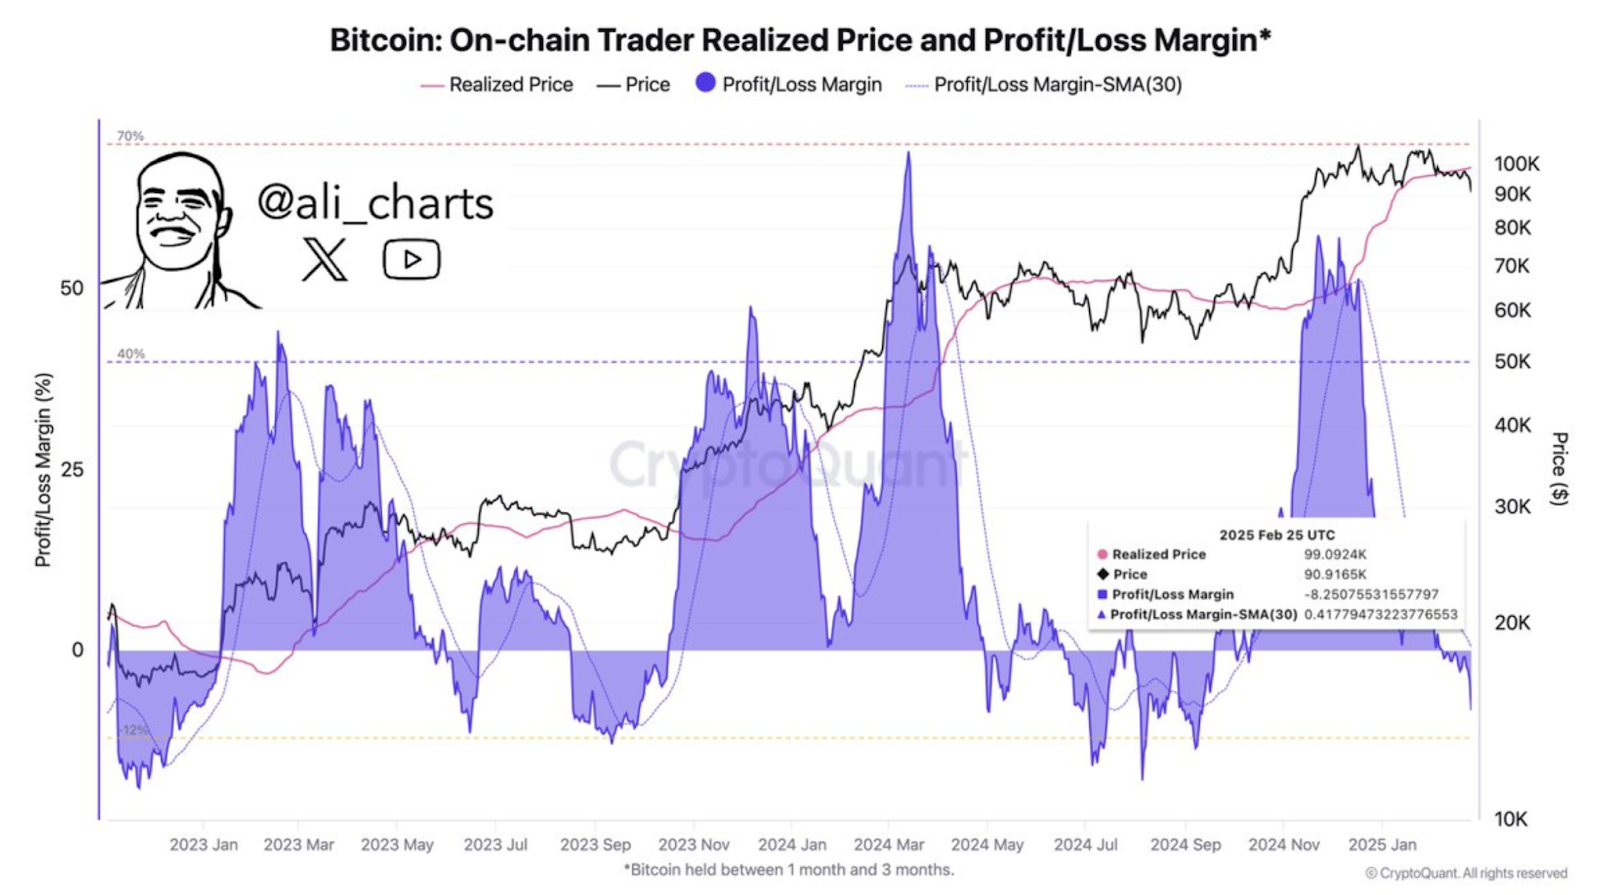
The above chart shared by a popular analyst, ALI, shows that since 2022, buying opportunities have always occurred when the trader’s realized loss margin hits -12%. Interestingly, the levels have reached -8.25%, suggesting the rally is inching close to the 2022 buy zone. While some believe the traders may find the buying opportunities mish before, the correlation between realized price & P/L margin raises some concern about market psychology & investor behavior.
So what’s next?
While some analysts believe the current rebound could be the end of the bearish trend, the liquidation levels suggest a diverse price action. After the latest price action, big, over-leveraged clusters have been mounted on both sides. This suggests the Bitcoin price may witness huge volatility in the next few days. Therefore, more downfall can be expected at the end of the month, and if the price begins the fresh monthly trade on a bullish note, then it may remain elevated until the end of the quarter.


