The on-chain analytics firm Glassnode has broken down which Bitcoin investor cohorts sold at the biggest loss during the latest price crash.
Recent Bitcoin Buyers Have Combined Realized $2.16 Billion In Loss Recently
In a new post on X, Glassnode has discussed what the capitulation event triggered by the Bitcoin price crash has been like. The indicator of relevance here is the “Realized Loss,” which measures the total amount of loss that the investors as a whole are ‘realizing’ through their transactions.
The metric works by going through the transfer history of each coin being sold on the network to see what price it was moved at prior to this. If this previous value for any coin was more than the price at which it’s being sold now, then the token’s sale could be assumed to be leading to loss realization.
The Realized Loss adds up the difference between the two prices for all such tokens to calculate the total for the network. Another metric known as the Realized Profit keeps track of the coins of the opposite type.
Generally, any sudden drop in the BTC price throws the investors into a panic and some loss-taking tends to occur, especially from the recent buyers, who don’t tend to be too resolute. The latest crash has been no exception to this. “Between Feb 25-27, over $2.16B in realized losses came from the most recent market entrants,” notes the analytics firm.
Below is the chart posted by Glassnode that shows the trend in the Bitcoin Realized Loss for the various BTC investor cohorts over the past month.
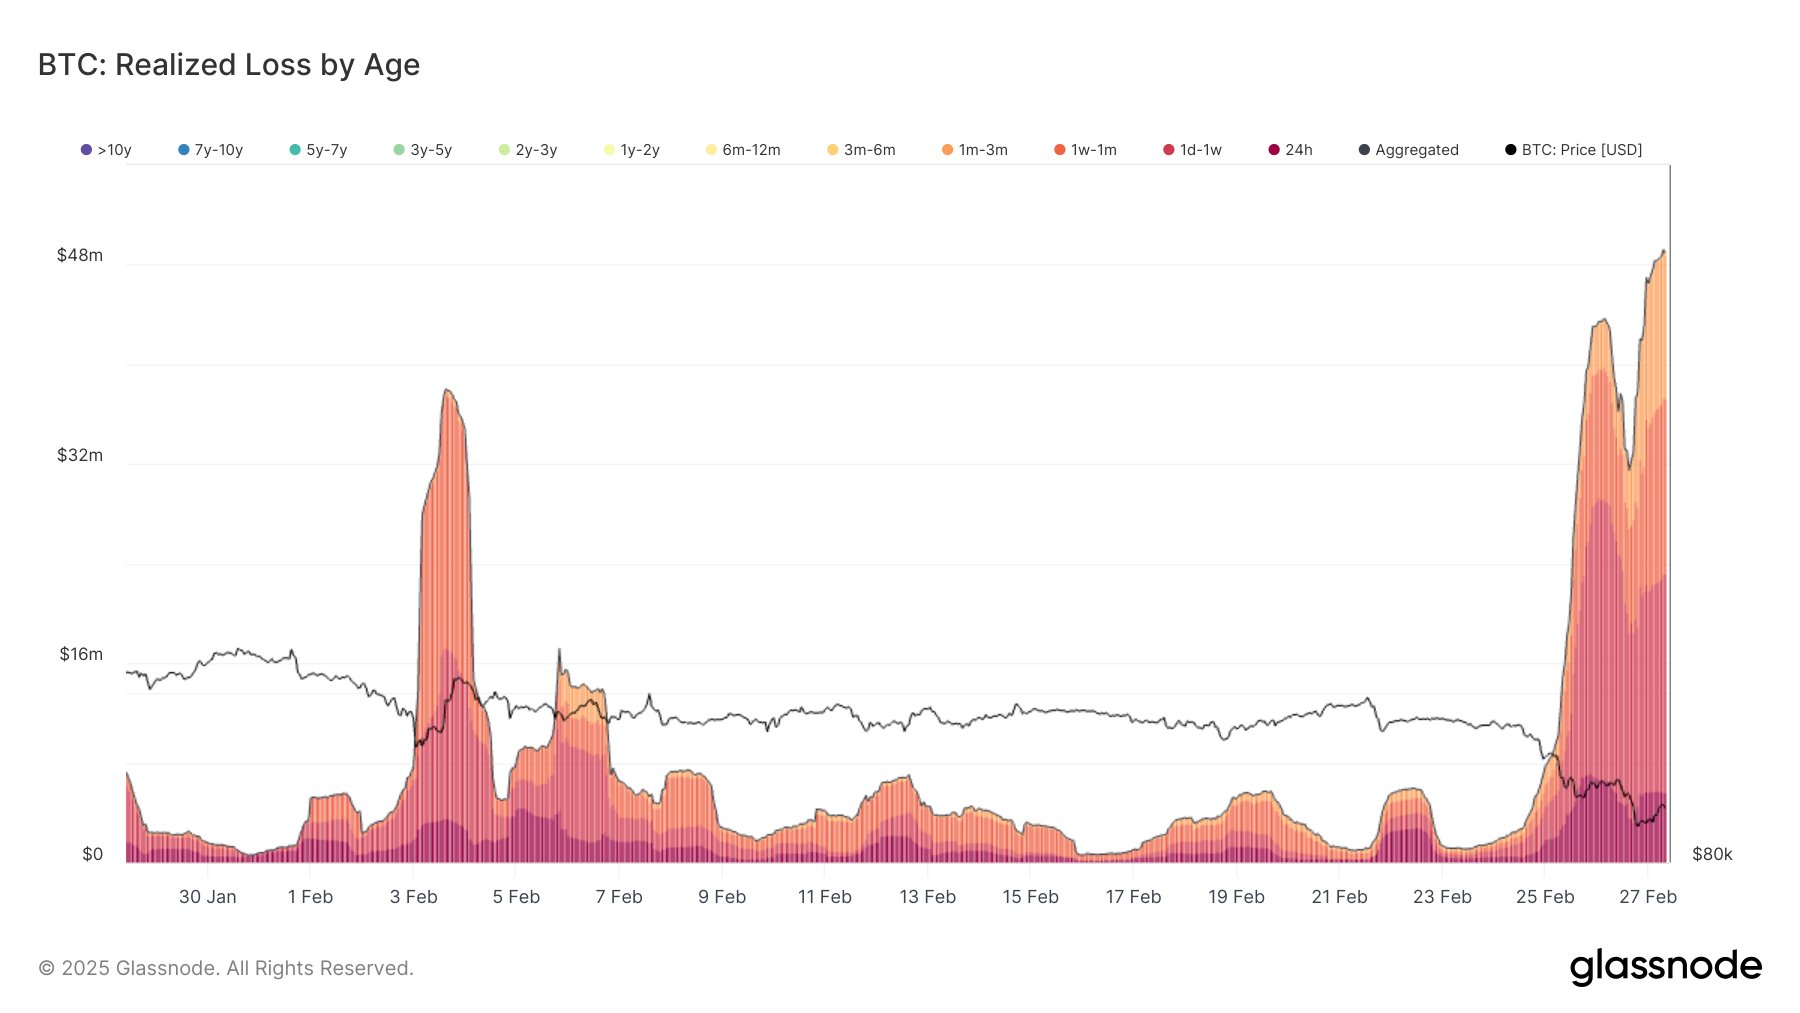
As is visible in the above graph, the older BTC cohorts have hardly participated in any loss-taking recently. This makes sense, as even after the crash, BTC is trading at higher prices than it was a few months ago, so those who have been holding for a long time would still be above water.
Out of the younger groups who have indeed sold at large losses, the numbers look like this: $322 million for 24 hours, $927 million for 1 day to 1 week, $678 million for 1 week to 1 month, and $257 million for 1 month to 3 months.
The cohort that stands out among these is the 1 day to 1 week one, which made up for more than 42% of the capitulation event. Thus, it would appear that the buyers who just got in within the past week ended up dumping the hardest.
As for how the latest selloff compares historically, here is a wider view of the Realized Loss chart:

BTC Price
At the time of writing, Bitcoin is trading around $86,200, down almost 12% in the past week.


