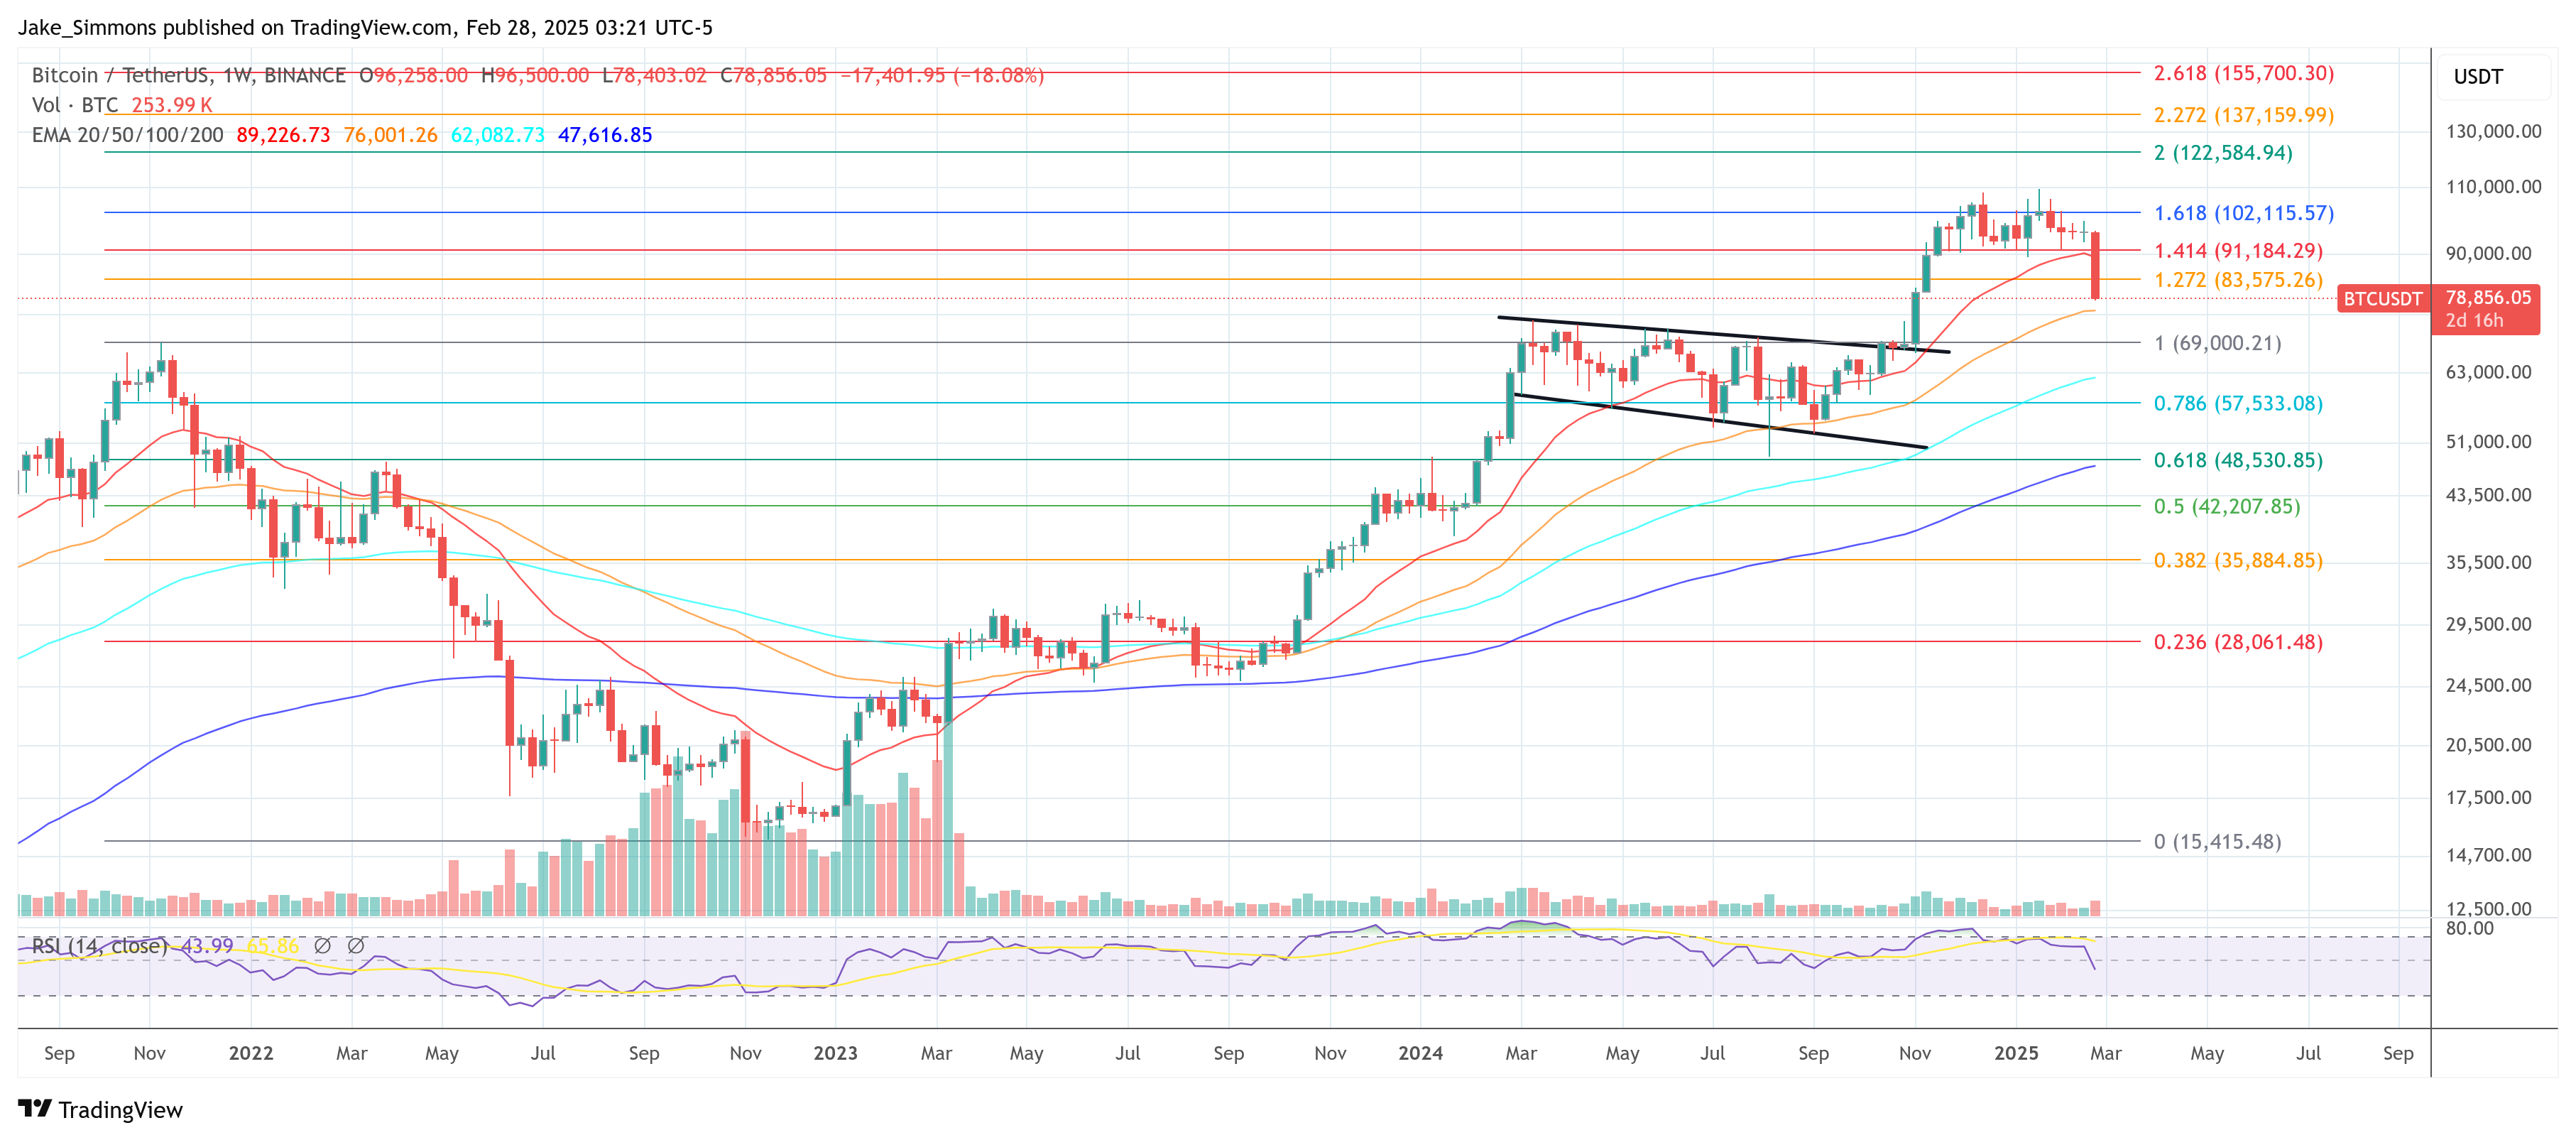
Bitcoin is experiencing a severe downturn over the past few days. After trading above $96,000 on Monday, its price slipped below $80,000 today for the first time since November 11. This rapid decline marks a nearly 18% slump since the start of the week. From its all-time high of $109,588 on January 20, Bitcoin has now shed approximately 27% of its value.
Several factors have converged to exert downward pressure on the cryptocurrency. These include the newly imposed Trump tariffs, large-scale outflows from spot BTC ETFs, and exceptionally high levels of liquidations in the futures markets. While sentiment has clearly taken a hit with the Fear and Greed Index at 16 (“Extreme Fear”), some analysts note that these conditions could also be setting the stage for the next significant move––be it further downside or a potential rebound.
How Low Can Bitcoin Go?
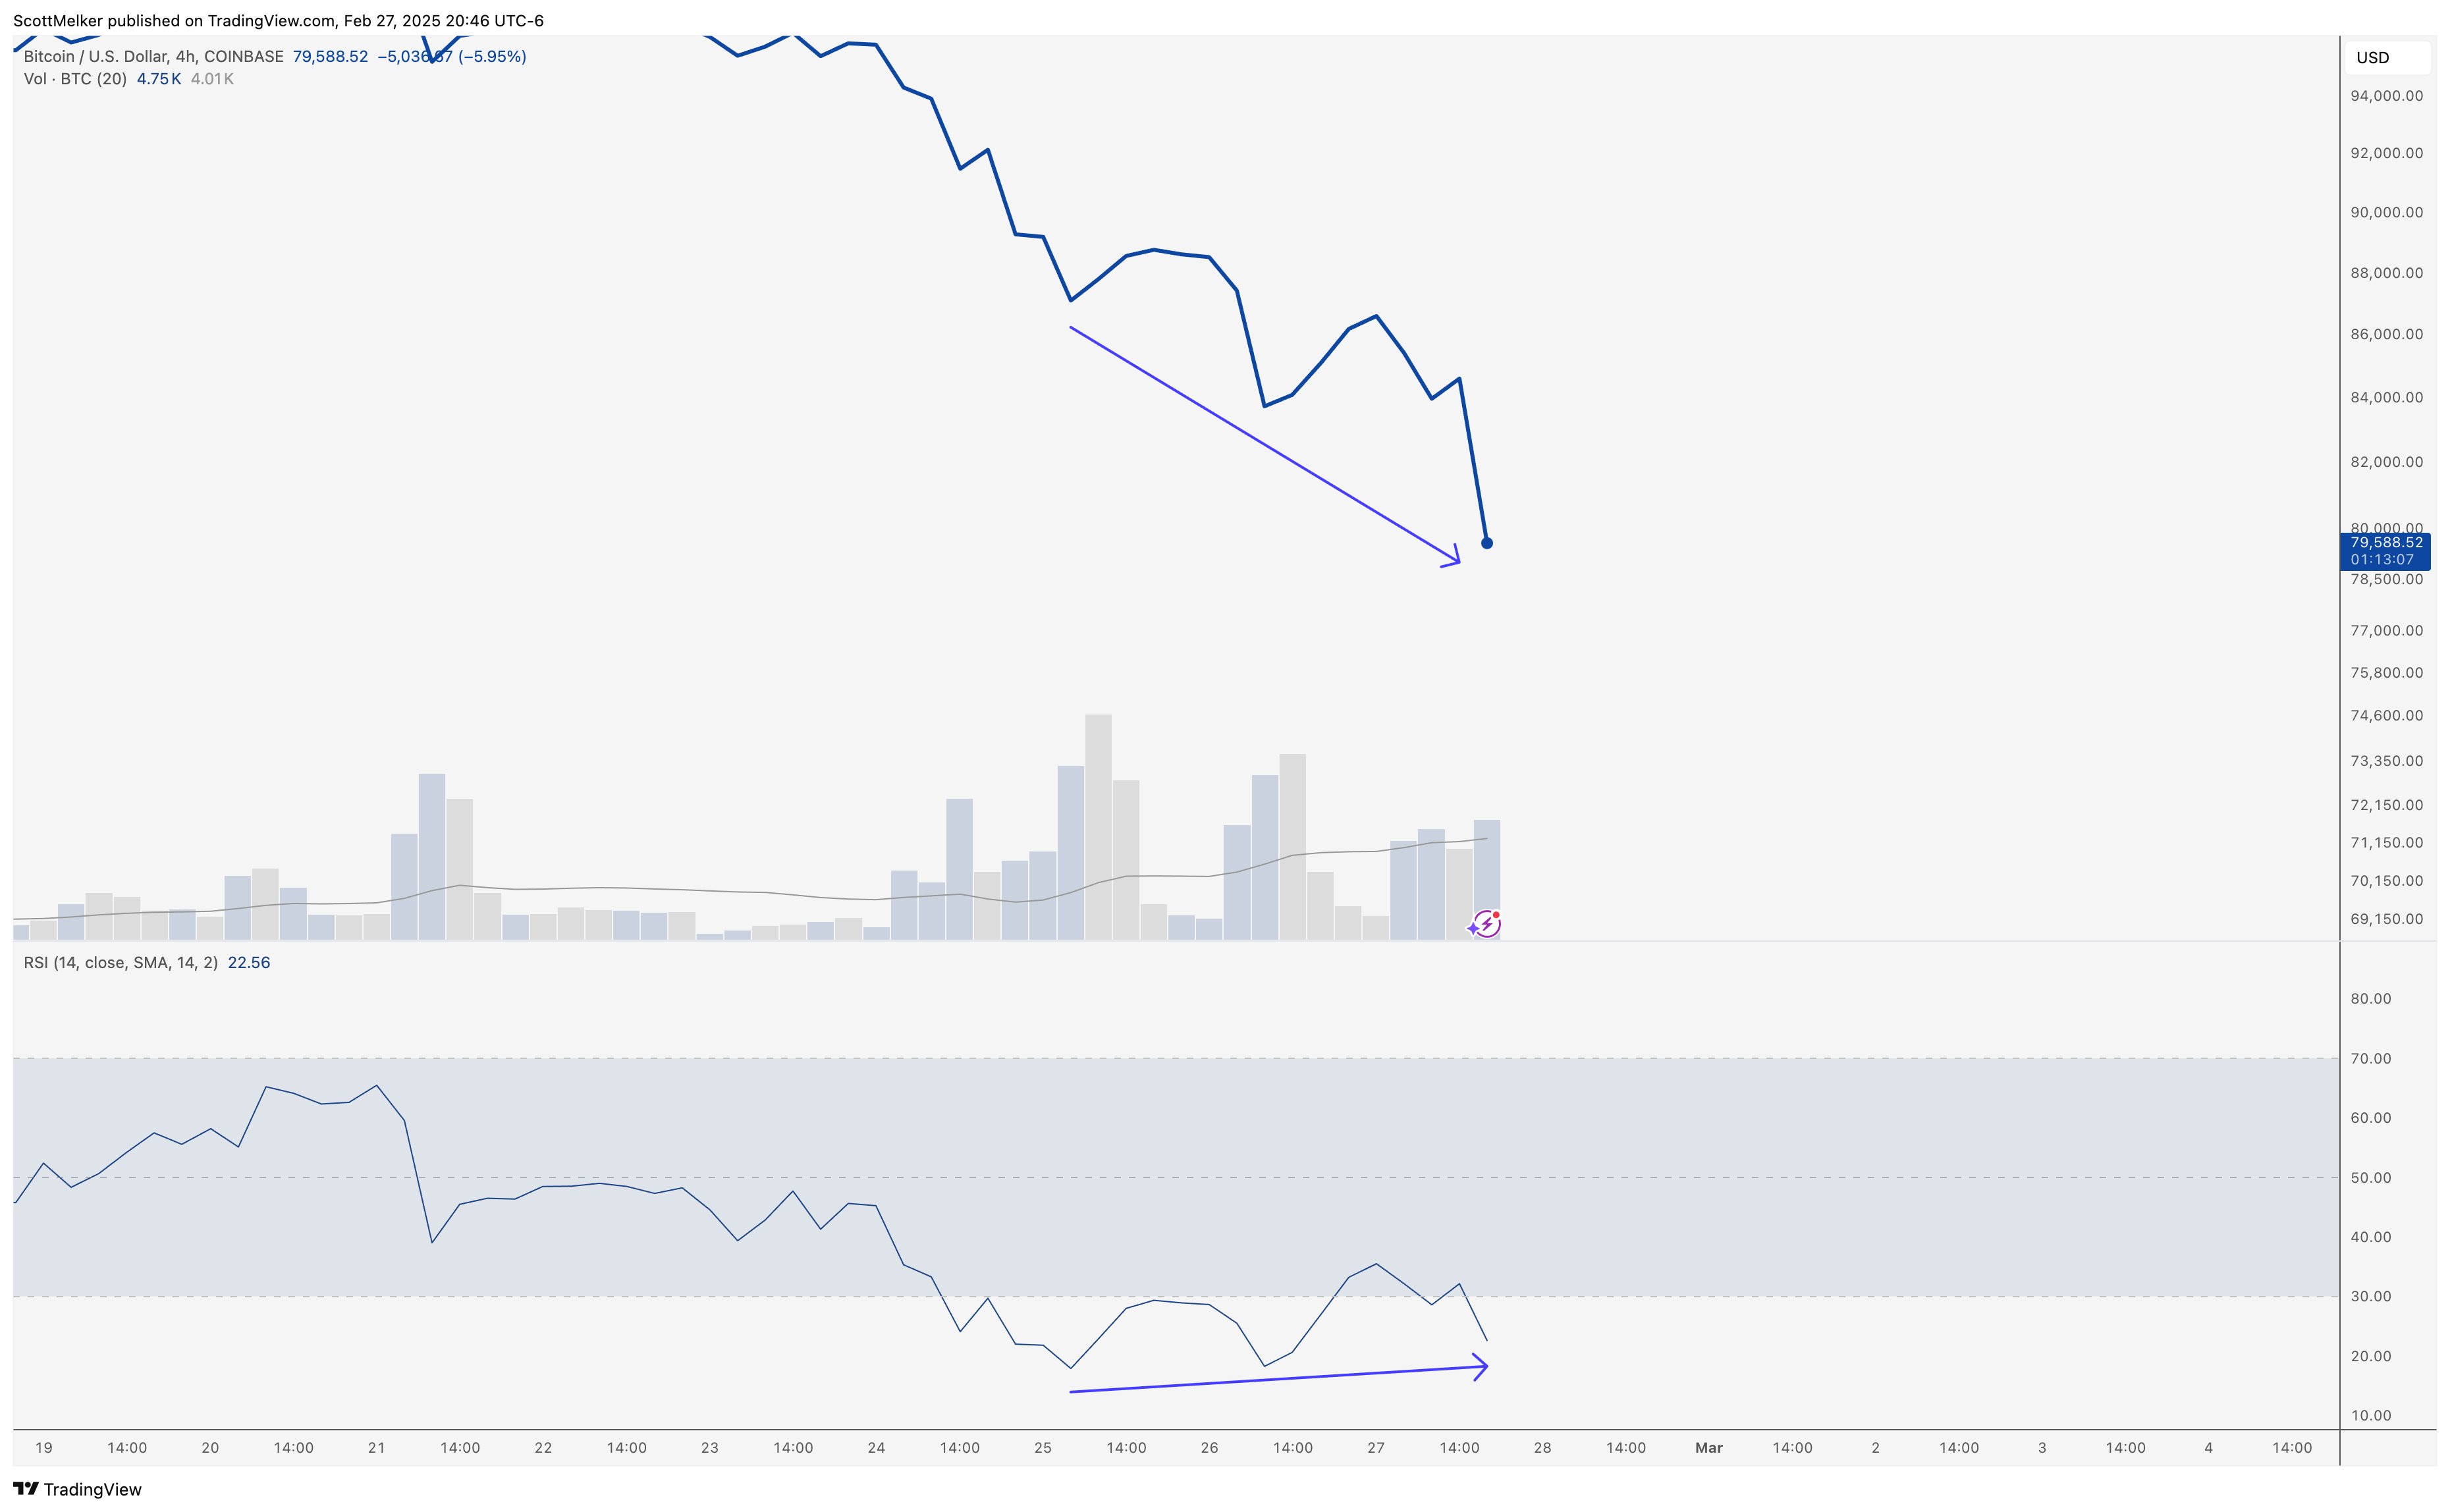
Renowned crypto analyst Scott Melker, also known as “The Wolf Of All Streets,” highlights a developing bullish divergence on multiple timeframes. In a post on X, Melker writes: “BTC 4-HOUR: Bullish divergence still building after the hidden bearish divergence I was watching for. This could fail, obviously, but RSI is holding up well. If you have been following me for years, this is my favorite signal when confirmed. Oversold RSI with bullish divs building over multiple timeframes.”
Technical analyst Tony “The Bull” Severino, CMT (@tonythebullBTC) believes the market may be tracing out a familiar corrective pattern similar to what occurred in 2021 and 2022. He suggests this pattern “could get an extended fifth of a fifth situation that takes us well into late 2025.” He added that “this does mean this could go a lot lower than many are expecting, to about $75,000 if the same higher degree fractal is followed to the 0.5 Fib retracement.”

Severino also cautions that traders “do not want to see Bitcoin tag the monthly Parabolic SAR, currently located at $75,742,” as a breach of that level could signal a deeper correction. He expects the Parabolic SAR will rise slightly by the monthly close, potentially pushing the critical support zone into the low $80,000 range.
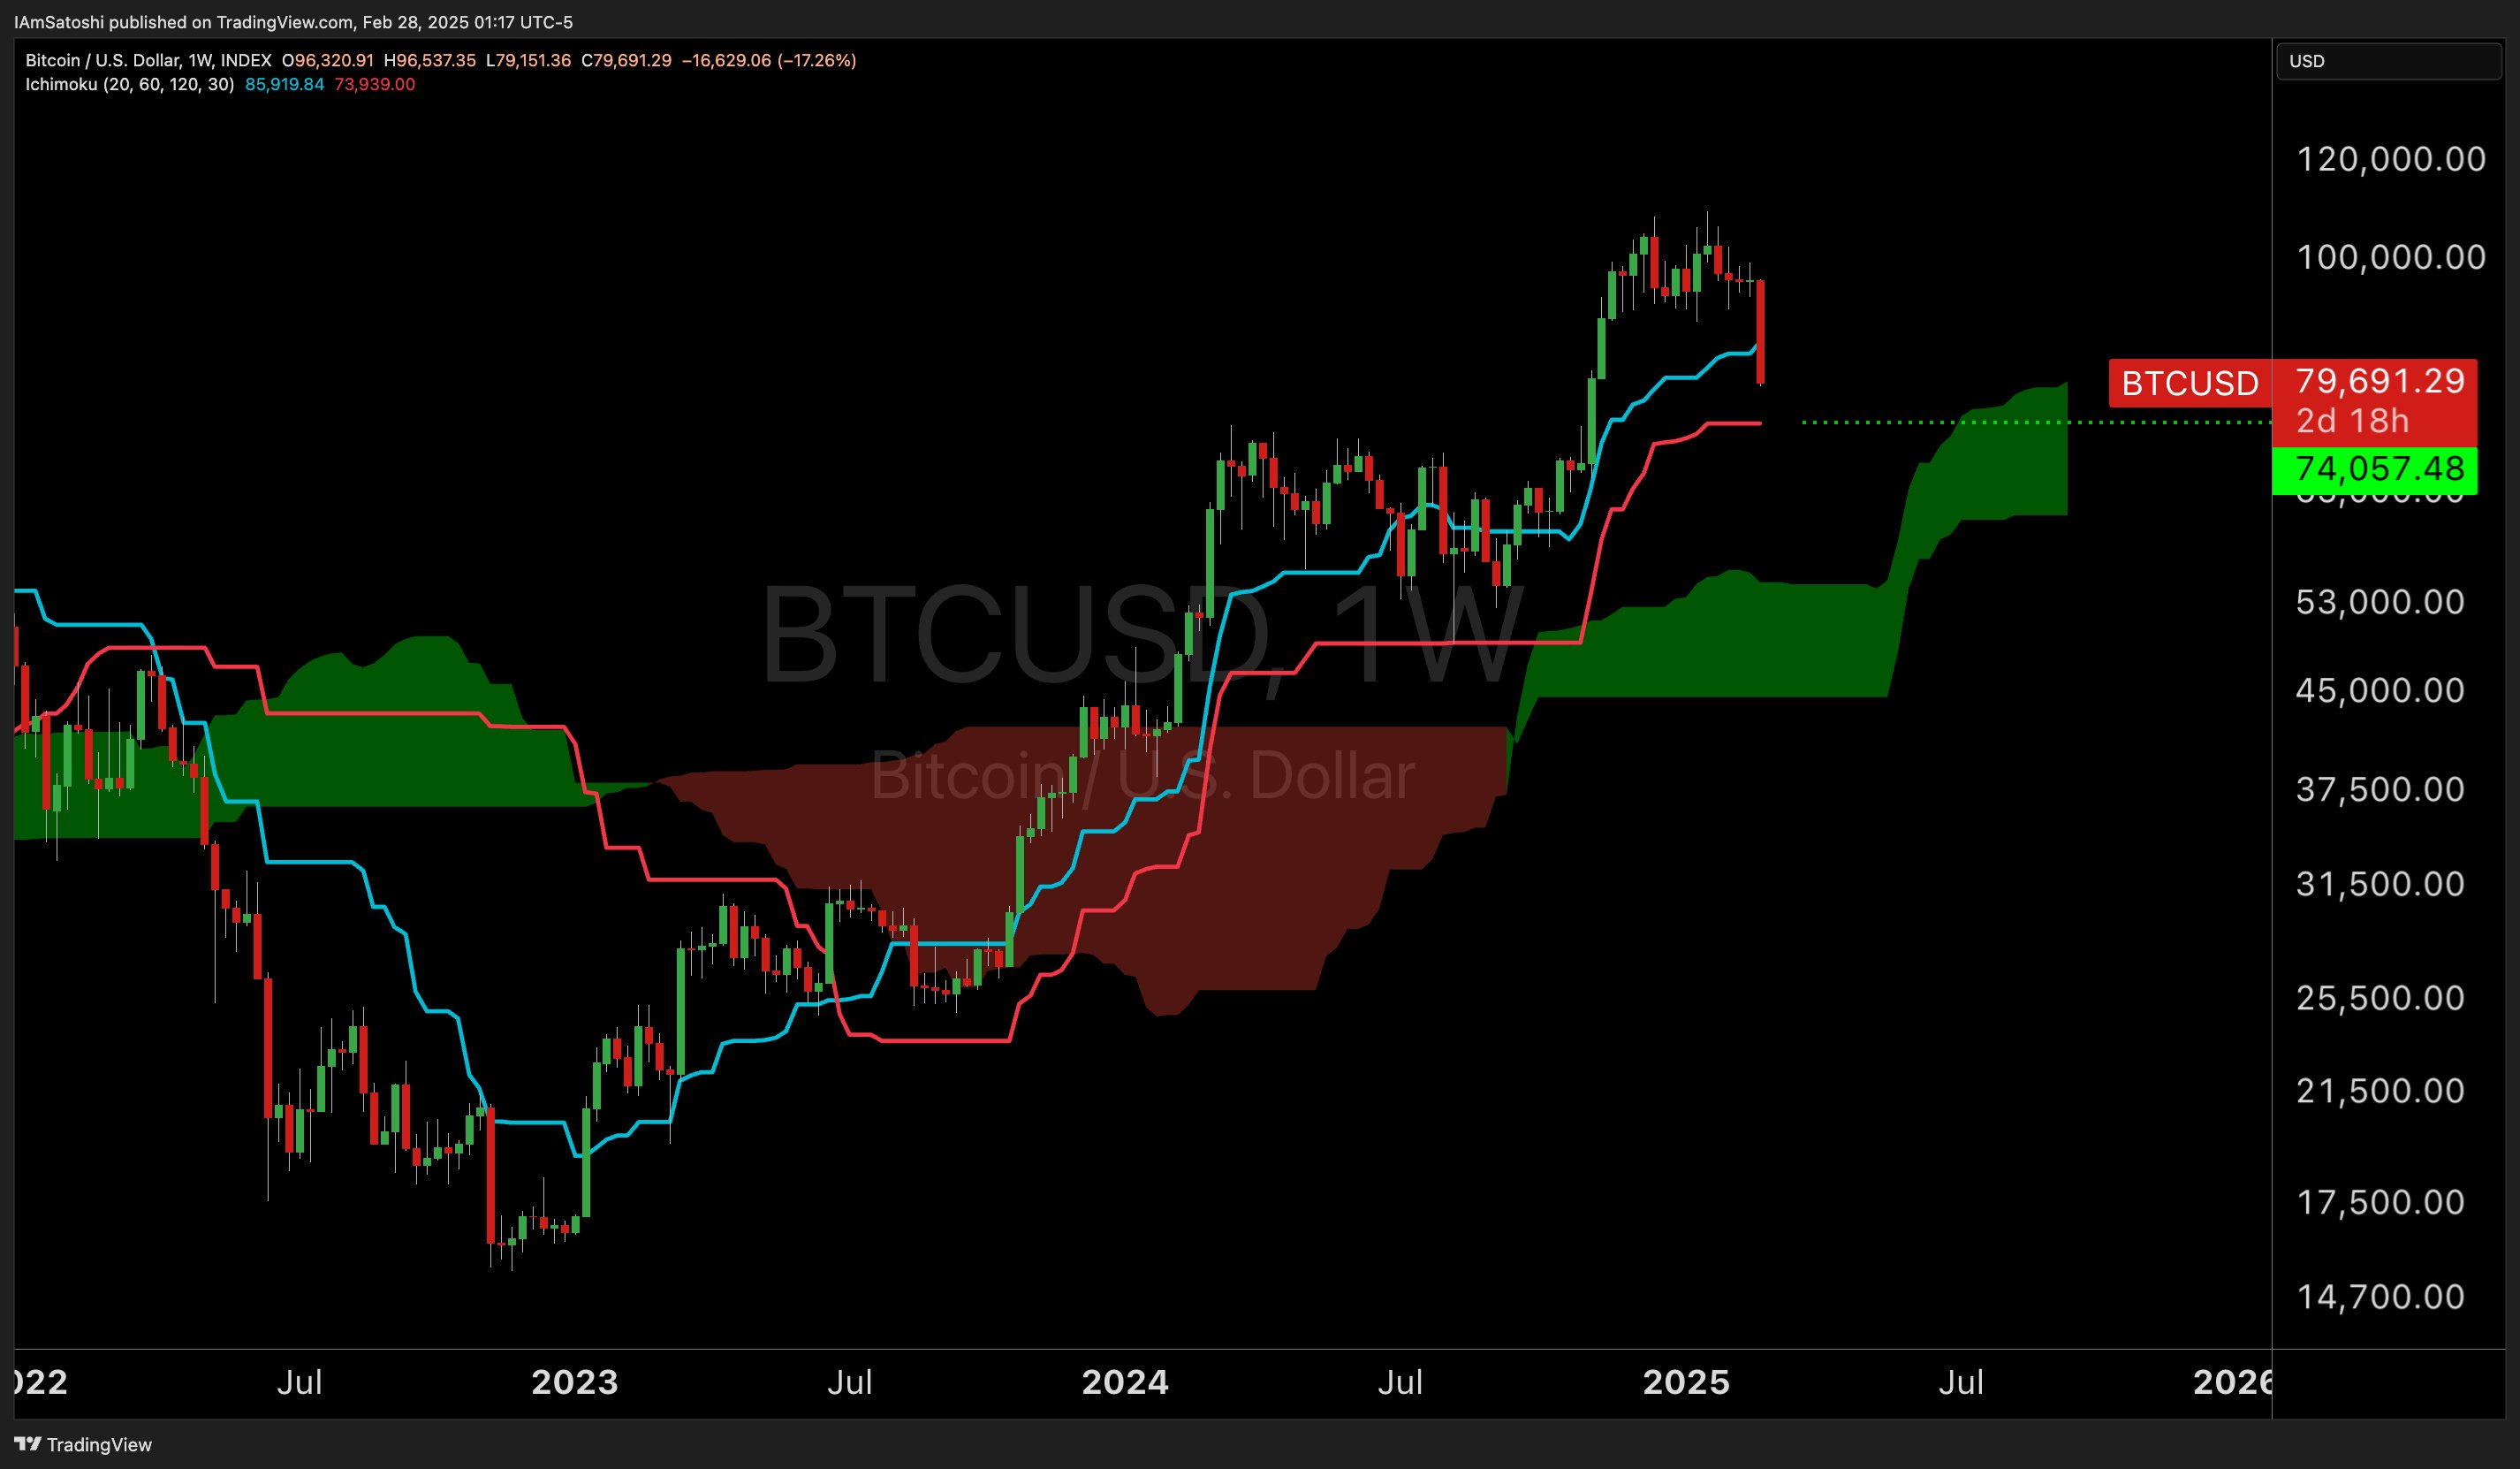
Prominent trader Josh Olszewicz (@CarpeNoctom) tracks the Ichimoku Cloud for key insights. He points to a possible retest of Bitcoin’s weekly kijun, referencing “weekly kijun support at 74k if we keep going.” Olszewicz notes Bitcoin last tapped the weekly kijun during the yen carry trade unwind in August 2024—an event that saw heightened volatility across global markets.
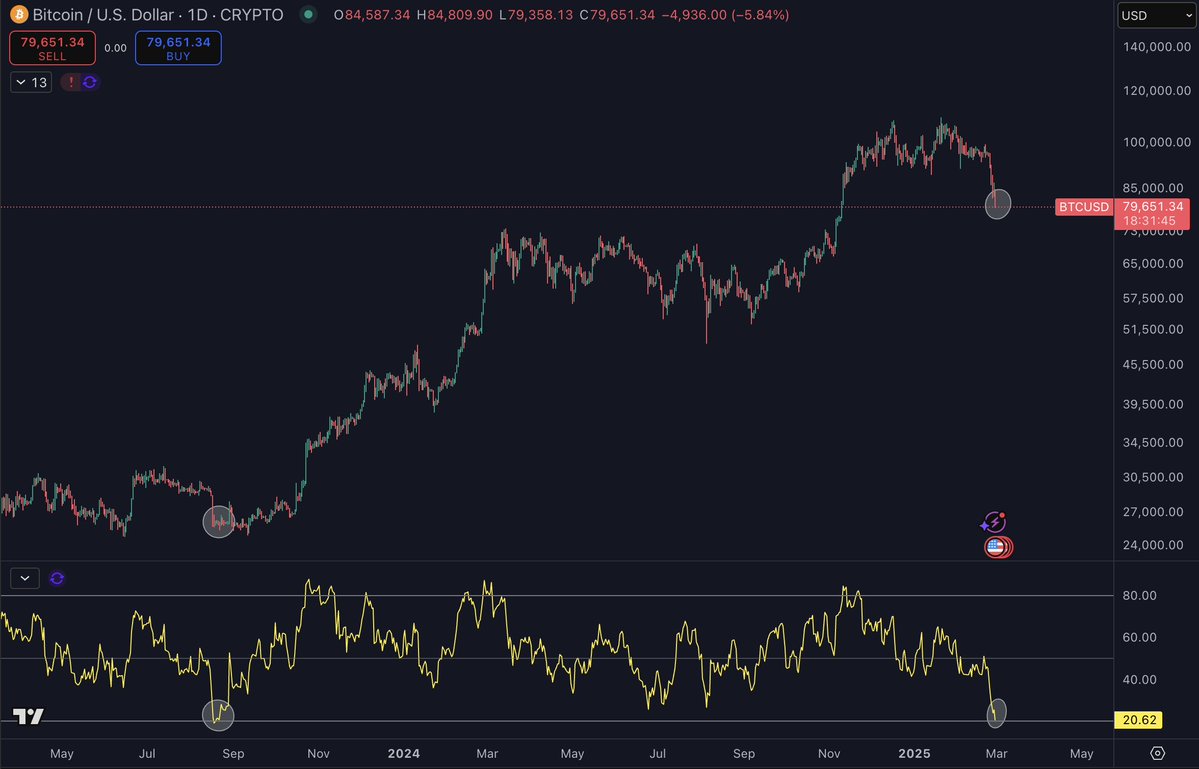
Analyst Daan Crypto Trades (@DaanCrypto) draws parallels with previous market cycles when Bitcoin’s Daily RSI dipped to the 20 level: “The last time BTC was this ‘oversold’ [at 20] on the Daily RSI was back in August 2023 when it was trading at $25K. The time before that was after the FTX implosion at the bear market bottom in late 2022. Short term this means little but it should start peaking your interest.”
He also spotted significant buy orders on Binance futures: “BTC ~$1.8 Billion in Bids has appeared on the Binance futures pair. These bids are sitting between $70K-$79K. What happens when bids like these appear is varied. Sometimes price never moves into them, when it does start hitting them, it often fills a lot of them before (shortly) reversing. Keep in mind, these are bids that can just as easily be pulled away. Highlighting this as it’s an insane amount and this is something you rarely ever see.”
Ki Young Ju, CEO of CryptoQuant, highlights the role of liquidity in determining Bitcoin’s trajectory. He noted spot volume was “highly active around $100K,” but explained that “prices drop when new liquidity dries up.” For Ju, the key question is: where will fresh liquidity come from if the market is already in a distribution phase?
He foresees a potential extended consolidation between “$75K-$100K,” resembling Bitcoin’s price action in early 2024. Such a range could persist until a fresh catalyst emerges. “We’ll likely see an extended consolidation in the wide range (e.g., $75K-100K), similar to early 2024, imo. This could last until some good news for Bitcoin brings in new liquidity,” Ju predicts.
At press time, BTC traded at $78,856.