The XRP price is showing signs of a potential breakout, with a crypto analyst pointing to key technical indicators that suggest a potential surge to $4. Notably, the cryptocurrency has been trading within a descending trendline, but a decisive move above this resistance could ignite a long-awaited rally to a new all-time high.
XRP Price Eyes Breakout To $4
According to pseudonymous TradingView crypto analyst ONE1iMPACT, the XRP price has been making lower highs, forming a descending trendline on the 8-hour chart. The analyst’s chart analysis highlights key technical indicators based on price action that suggest that the XRP price may be gearing up for a possible rally to $4.
XRP’s projected surge to a $4 ATH is dependent on how it reacts to the descending trendline, which acts as a critical resistance area. With this in mind, a breakout and close above this trendline with higher-than-average volume signals bullish momentum for the XRP price.
Interestingly, the analyst disclosed that the market is currently hovering near or just below a key Moving Average (MA), indicated by the blue line in the chart. If XRP’s price can reclaim and hold above this MA, it would reinforce its bullish position and solidify the analyst’s optimistic price target. On the flip side, if it remains below this MA, the TradingView expert believes that it would put a barrier to its upside potential.
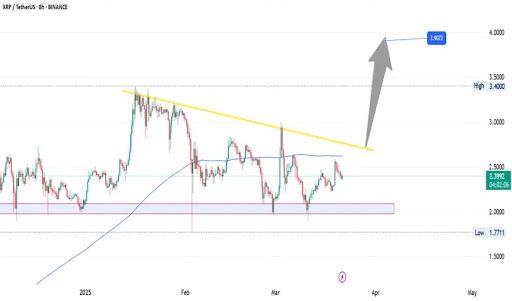
Moving forward, the analyst has shared key technical areas that could determine XRP’s next price movements. He revealed that if the cryptocurrency breaks above the descending trendline, the next major resistance area is the horizontal level around $3.40. Furthermore, a confirmed breakout could send its price toward $3.9 – $4.00, aligning with the target shown by the grey arrow in the chart.
The TradingView crypto expert warned investors and traders to pay attention to the volume and momentum of XRP as it aims for a descending trendline breakout. He explained that a low volume push above the trendline is a clear indication of a possible fakeout, where traders could be lured into entering long positions, only for the price to trace quickly. On the other hand, a high volume surge confirms the conviction of XRP’s bullish potential, leading to a sustained upward momentum and increasing prices.
The analyst also added that oscillators like the Relative Strength Index (RSI) and Moving Average Convergence Divergence (MACD) could help traders gauge whether XRP’s momentum is building or fading as its price approaches the descending trendline resistance.
Possible Downside Target If Resistance Fails
In his analysis, ‘ONE1iMPACT’ also shared a bearish outlook for the XRP price if it fails to break and close above the descending trendline resistance. The TradingView analyst revealed that a rejection at this trendline could trigger further consolidation and decline for XRP.
He has shared several important support levels that could help prevent an even deeper correction in the XRP price. The $2.0 and $2.1 region, marked by the pink and gray box on the chart, acts as a strong support area for XRP, where buyers have stepped in before.
If the XRP price loses this zone, the analyst predicts a major breakdown toward $1.8 – $1.77. Another decline below this price low could result in a much larger correction.


