An analyst has pointed out how XRP and three other altcoins look like they share a similar technical analysis (TA) fate. Here’s what could be in store for these assets.
TA Patterns Are Pointing At Same Outcome For Four Altcoins
In a new post on X, analyst Ali Martinez has pointed out a commonality that may be present among XRP (XRP), Ethereum Classic (ETC), Bitcoin Cash (BCH), and yearn.finance (YFI).
The similarity lies in the signal that TA is giving on the price charts of each of these altcoins. Here are the graphs the analyst shared, showing the patterns:
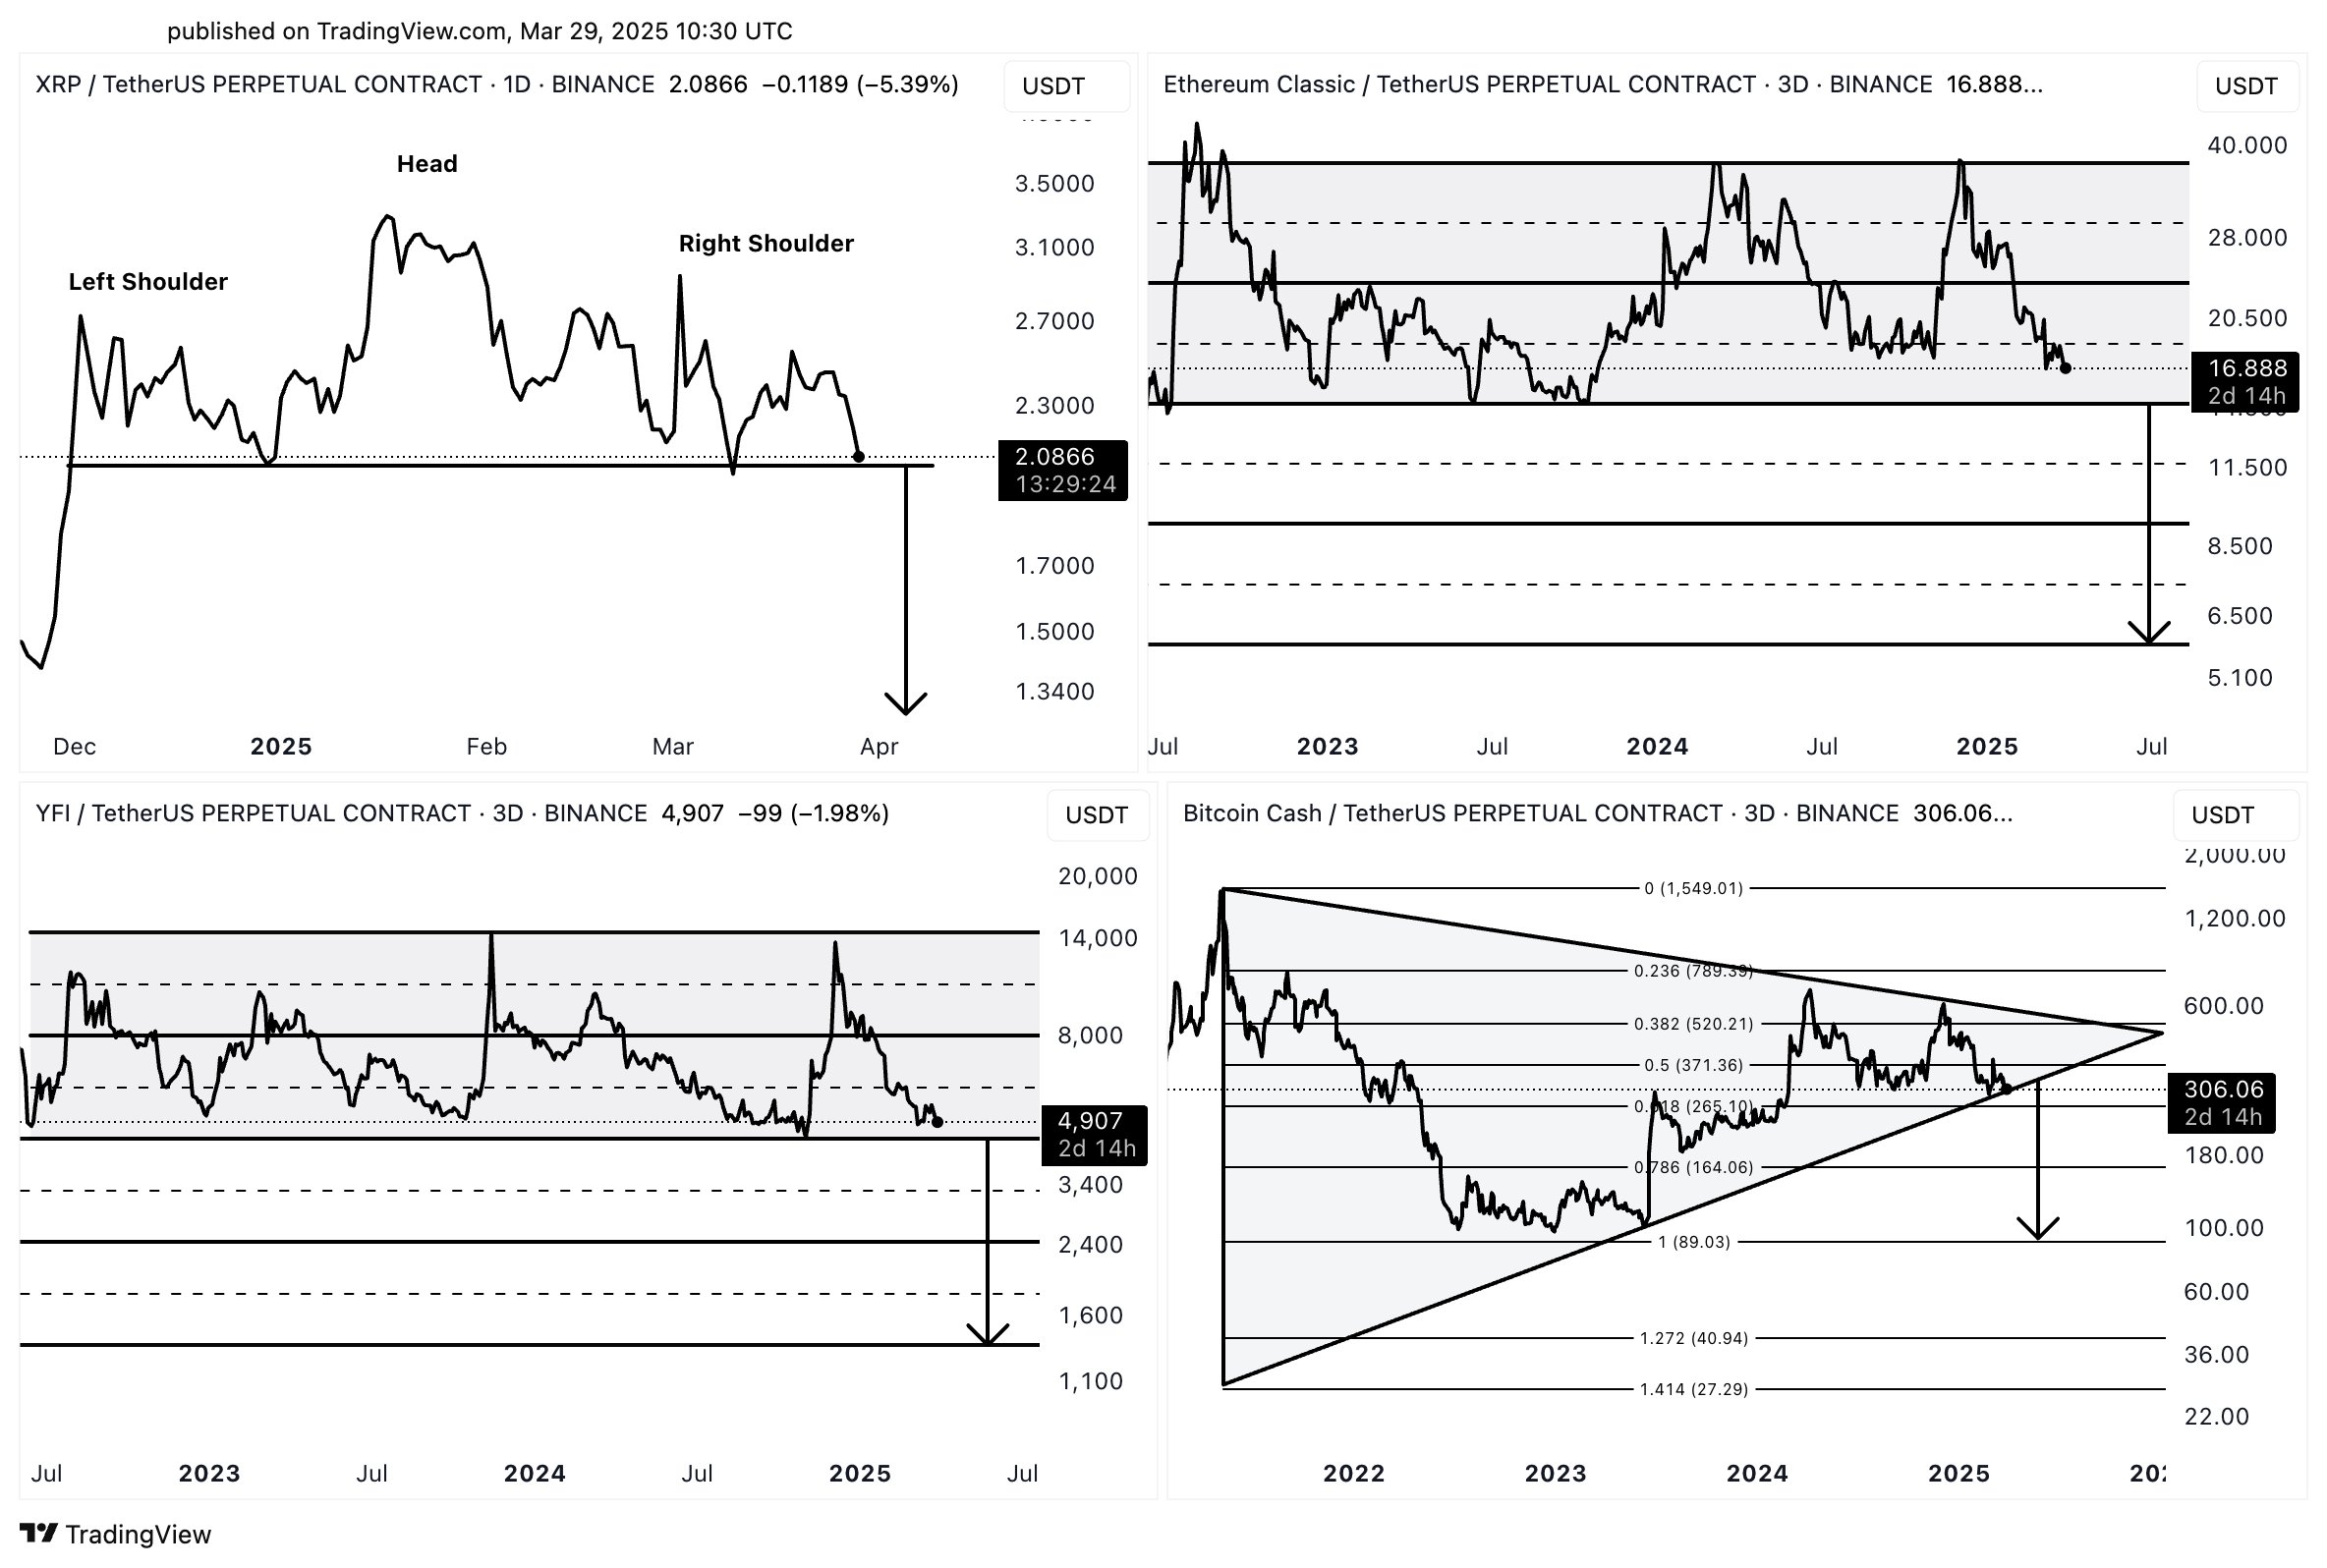
The first chart (top left) highlights the trend in the 1-day price of XRP, the fourth largest cryptocurrency by market cap. It would appear that the asset has possibly been forming what’s known as a head-and-shoulders pattern.
This pattern forms when an asset’s price shows three peaks following a sharp surge, with the inner and outer peaks being similar in scale (the shoulders), and the middle one the largest (the head). The formation also involves one other feature: a support trendline that facilitates the formation of the different peaks.
From the graph, it’s apparent that XRP is currently retesting this support line, after forming its third peak (the right shoulder). The head-and-shoulders generally signal a reversal of trend, so it’s possible that the coin may end up failing this retest and a sharp plunge would follow next.
Bitcoin Cash, the bottom right chart, is also making a retest of what could be an important support line. In this case, the trendline is the lower one of a symmetrical triangle.
The symmetrical triangle occurs when an asset finds itself consolidating between two trendlines that converge at a roughly equal and opposite slope. This means that as the price travels inside the channel, the distance between its tops and bottoms progressively becomes narrower.
The upper channel provides resistance and the lower one provides support, but as the consolidation gets very narrow (that is, the price approaches the apex of the triangle), a breakout can become likely.
Recently, Bitcoin Cash has come quite close to the triangle’s end, so it’s possible that an escape may be happening soon. As BCH is retesting the lower trendline right now, it’s possible that this break could happen towards the downside. Such a breakout, if one happens, could be a bearish signal for the coin, just like the one for XRP.
The other two altcoins, Ethereum Classic (top right) and yearn.finance (bottom left), are both near the bottom line of a parallel channel. In this pattern, consolidation occurs between two parallel trendlines.
It’s possible that support might end up holding for these coins, just like it has in the past, but given the fact that they have been trading inside the channel for a couple of years now and that a shift toward a bearish mood has taken place in the sector, a breakout to the downside may be coming.
It now remains to be seen if XRP and the other altcoins will end up following in the trajectory that TA has been hinting at or not.
XRP Price
At the time of writing, XRP is trading around $2.06, down over 16% in the last seven days.


