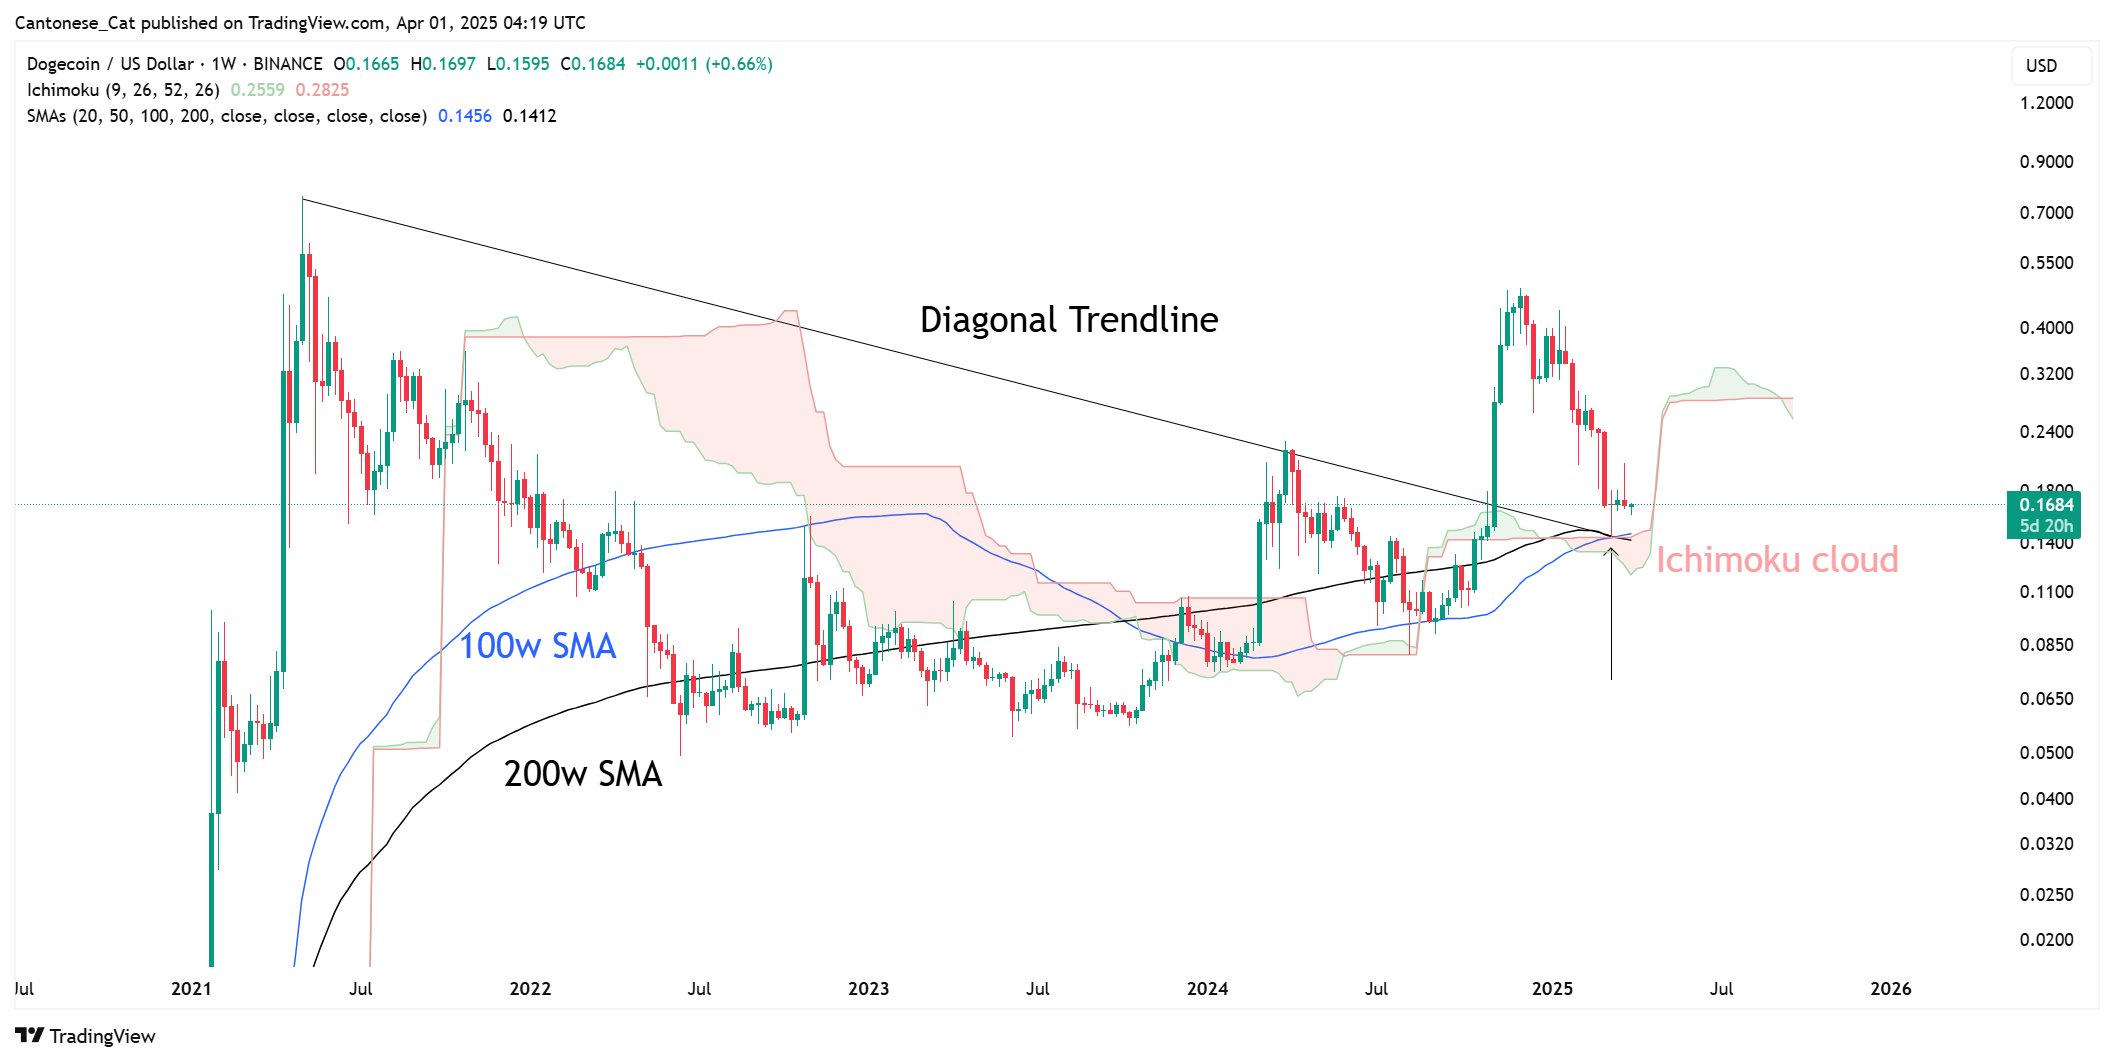
Crypto analyst Cantonese Cat (@cantonmeow) is describing the weekly Dogecoin/ USD chart as a technical beauty due to multiple indicators aligning at once. In the latest chart shared on X, several key features stand out, including a long-term diagonal trendline, converging 100-week and 200-week simple moving averages (SMAs), and a noteworthy Ichimoku Cloud setup. “I haven’t seen something this beautiful with this much confluence for a while,” the analyst notes.
Why Dogecoin Looks ‘Beautiful’ Bullish
A dominant downward-sloping diagonal trendline, drawn from Dogecoin’s historic 2021 peak of approximately $0.70, sets the tone for the chart’s structure. Since Dogecoin’s meteoric rise and subsequent fall in 2021, weekly candles have consistently responded to this diagonal, which has acted as a barrier to bullish advances and occasionally served as a place for price consolidation.
In November last year, DOGE broke above the trend line. However, over the past four weeks, Dogecoin has once again drifted downwards into close proximity to this trend-defining line. Dogecoin’s current revisit to the trendline represents a retest of the previous breakout; a successful defense at this level would confirm the retest, a scenario widely regarded as highly bullish from a technical analysis perspective.
Another focal point is the relationship between the 100-week simple moving average (SMA) and the 200-week SMA. In the chart shared by Cantonese Cat, the 100-week SMA is drawn in blue, while the 200-week SMA is depicted in black. The 100-week SMA is currently hovering at $0.1456, while the 200-week SMA sits at $0.1412.
Notably, the recent crossing of the 100-week SMA above the 200-week SMA has formed a bullish “golden cross,” a technical event typically interpreted as a strong positive signal for price momentum from a technical analysis perspective.
The chart also incorporates an Ichimoku Cloud, which further intensifies the convergence. The weekly Ichimoku setup (commonly using parameters 9, 26, 52, 26) displays a convergence with the weekly SMAs around $0.14. At present, Dogecoin’s price has approached the upper boundary of that Cloud, and stayed above it.
If the price were to sustain a close above the Cloud, it would strengthen the case for a bullish continuation. Notably, the Future Cloud Outlook is also bullish. The leading spans (projected forward) around $0.24 to $0.28 suggest a broad zone that could either cap upside moves or act as a magnet, should buyers maintain conviction.
Cantonese Cat refers to this juncture as “beautiful” precisely because of the overlapping significance of these 4 indicators. If Dogecoin remains above critical support level ner $0.145 for consecutive weekly closes, the likelihood of a sustained uptrend can rise considerably.
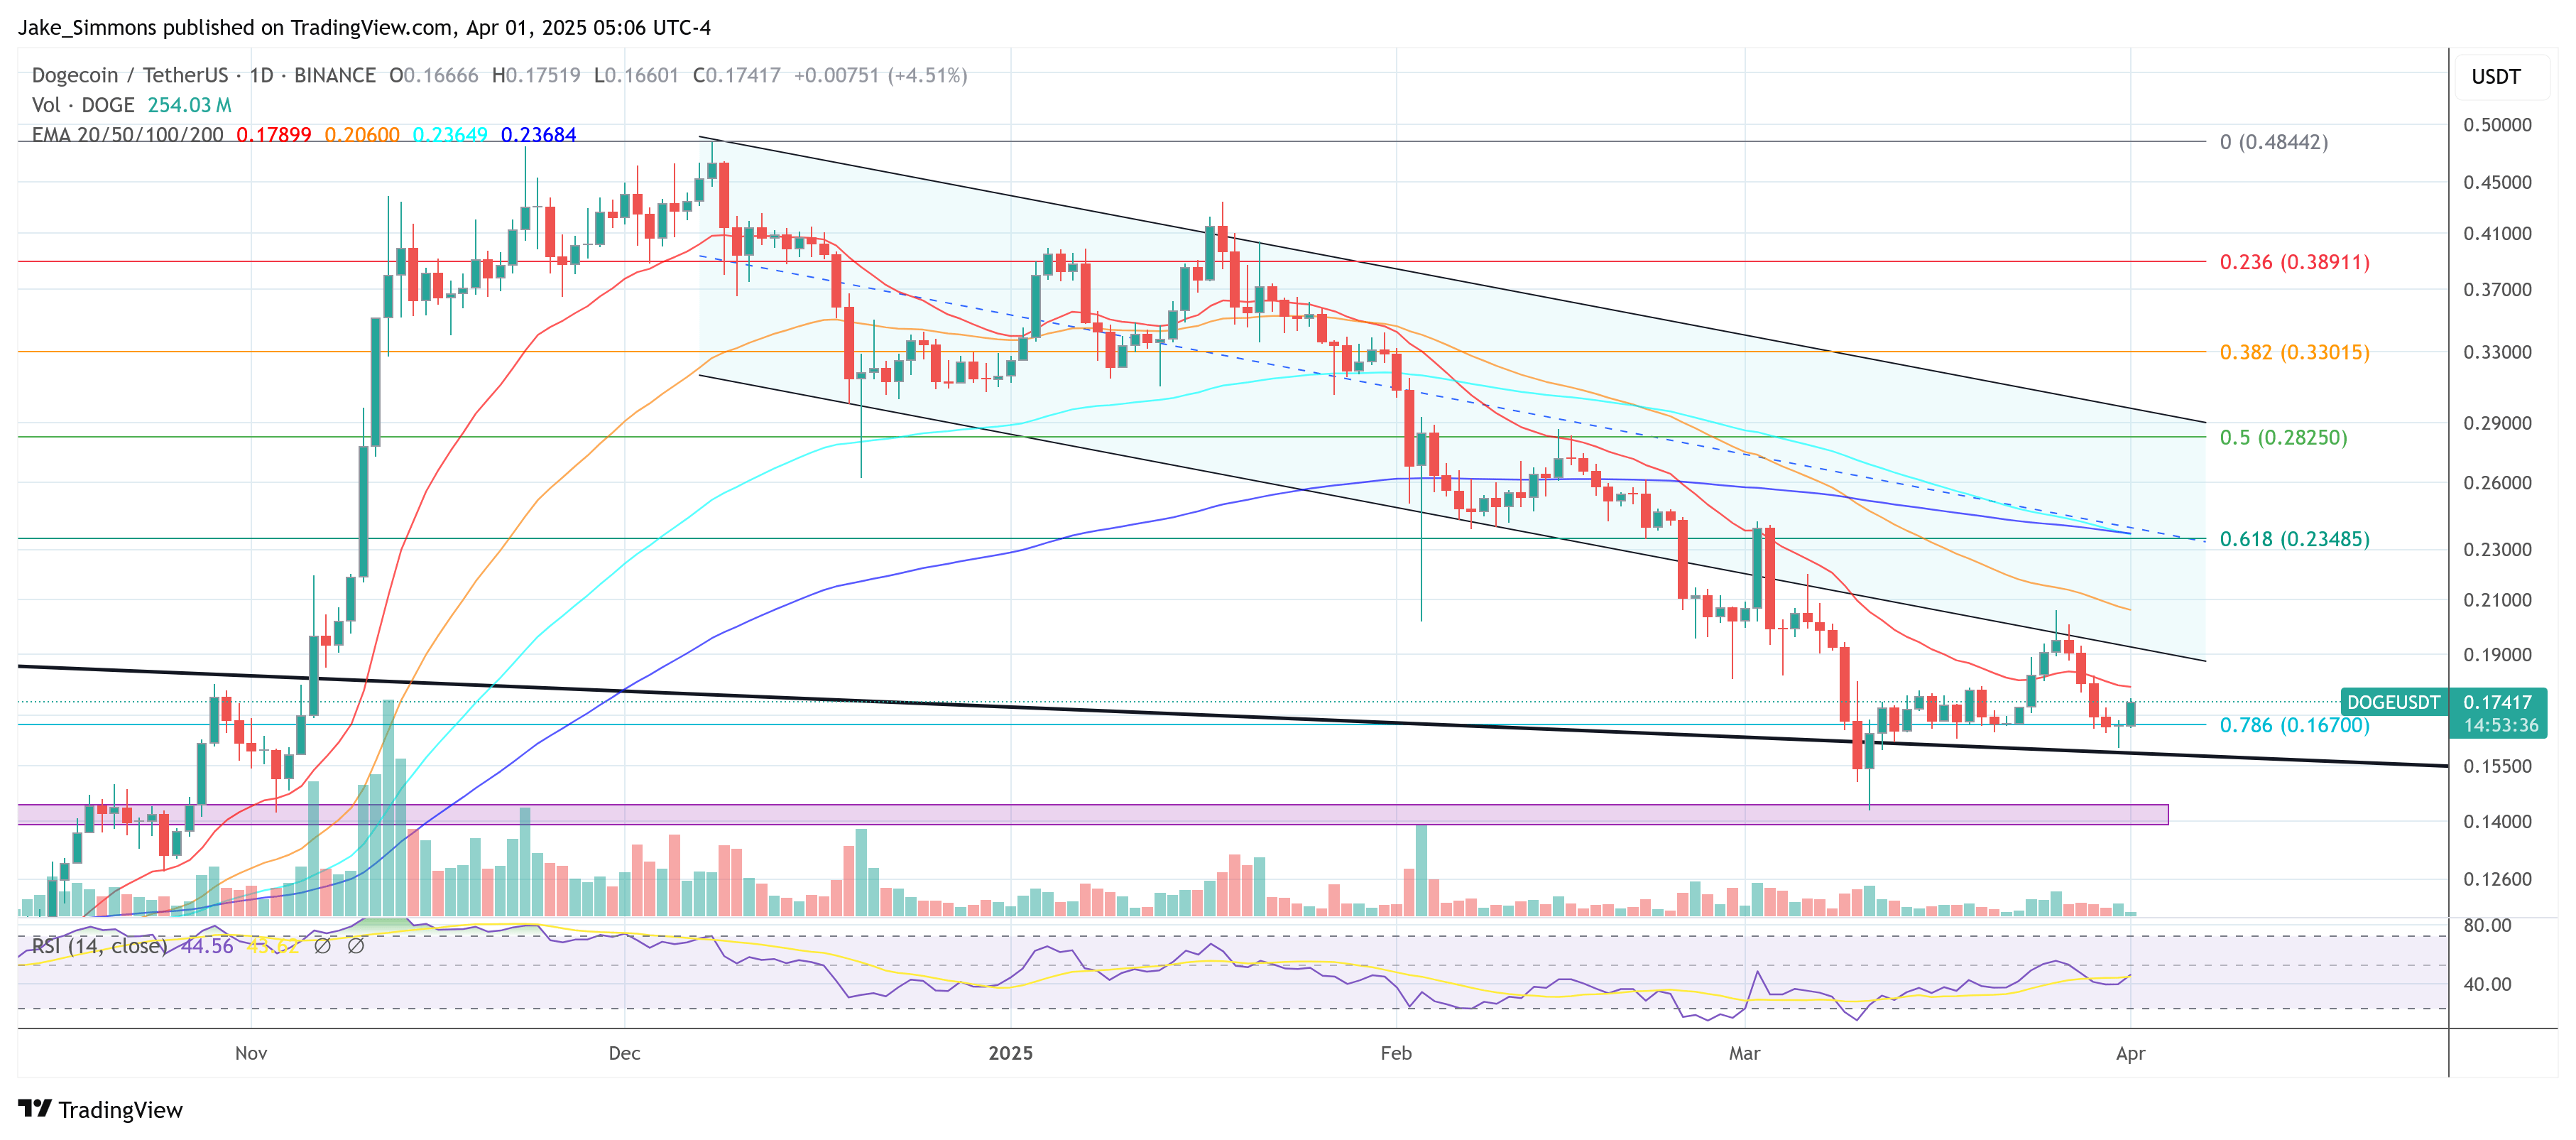
At press time, DOGE traded at $0.17417.